
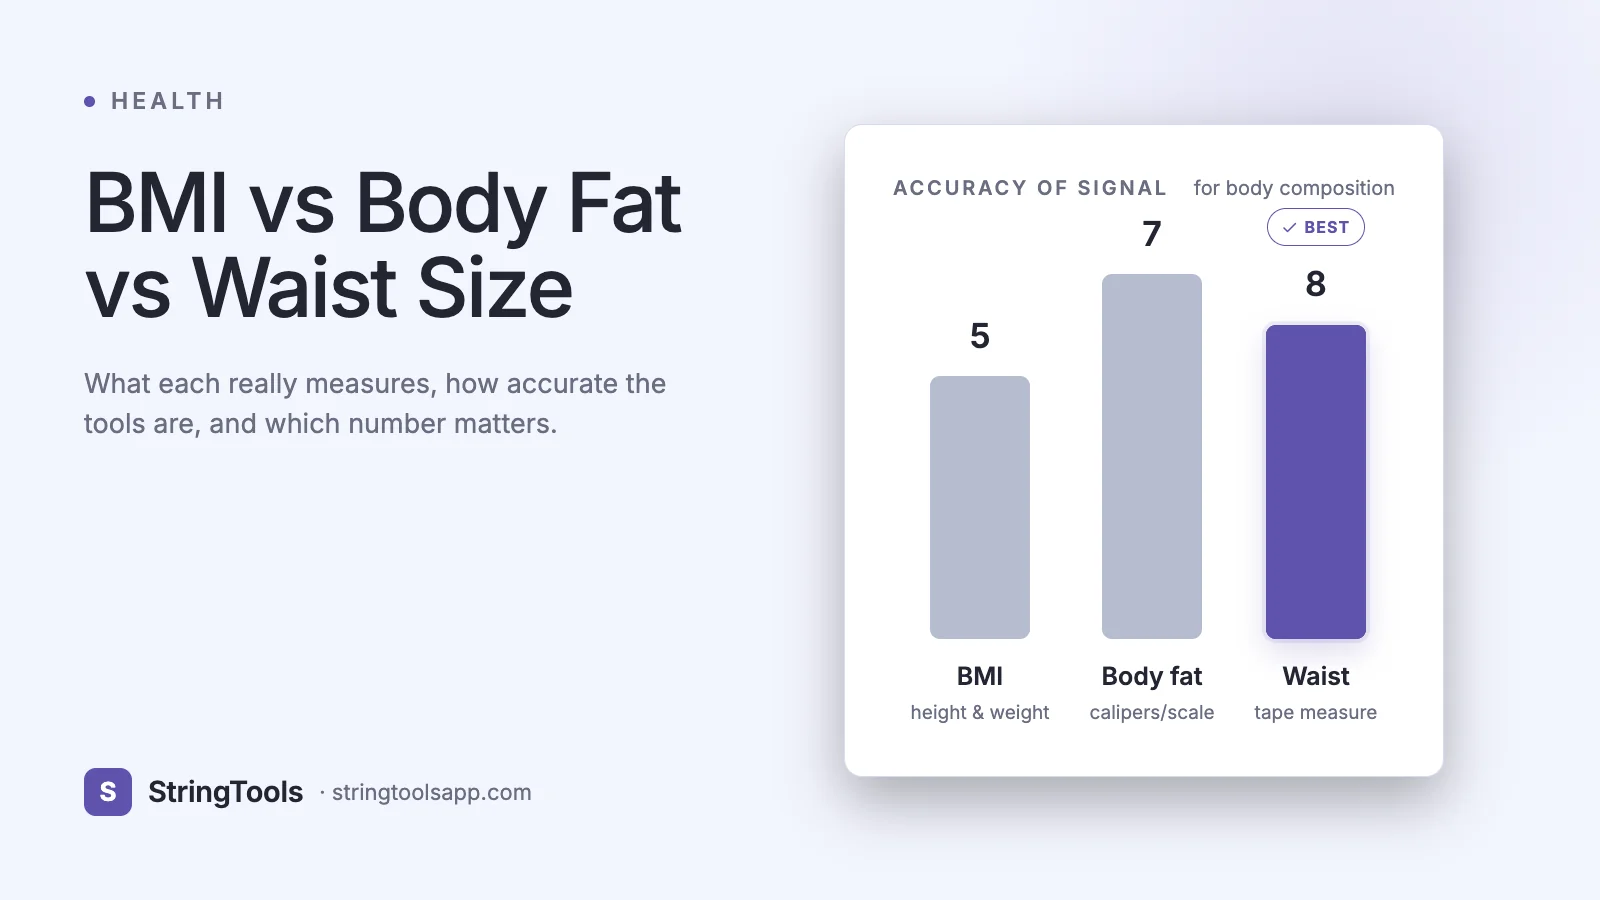
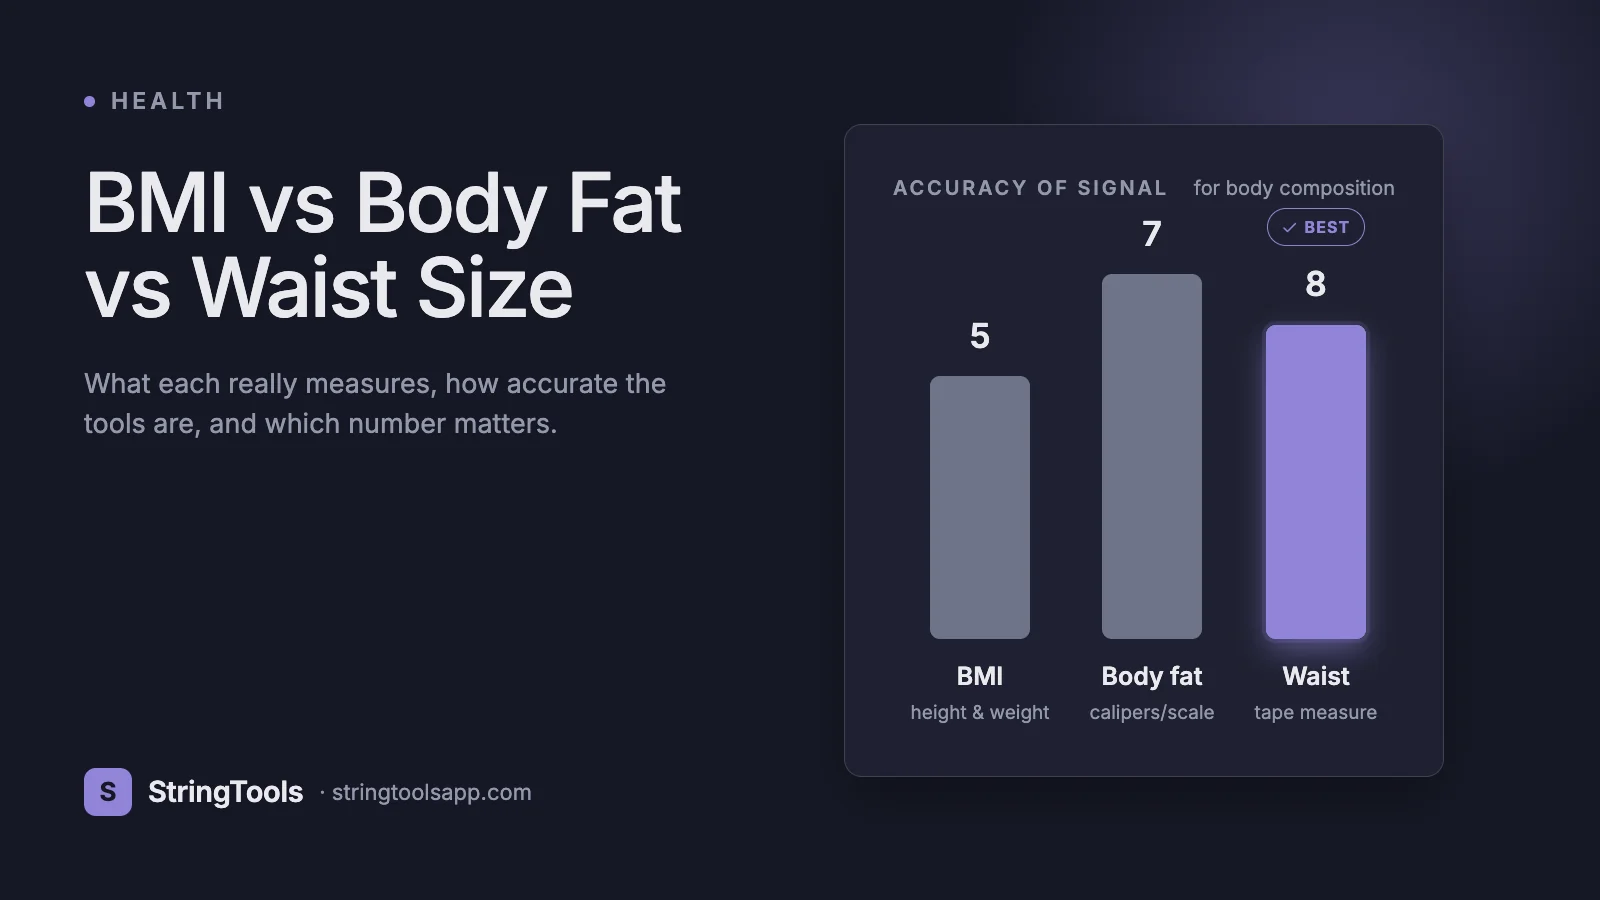
Quick answer: They measure different things, and each has a job. BMI (weight ÷ height²) is the fastest screen but can't see composition. Body fat percentage describes what you're made of but is hard to measure accurately at home. Waist size is the best simple predictor of metabolic risk because it tracks visceral fat — keep it under half your height. The winning combo for most people: BMI as the quick screen, a monthly waist measurement for risk, and body-fat trends (not single readings) for training progress.
Three Numbers, One Body
Step on a smart scale and you get a weight, a BMI, and a body-fat percentage before your coffee's ready. Wrap a tape measure around your middle and you get a fourth number. They rarely agree with each other — a person can be "healthy" by one, "overweight" by another, and "at risk" by a third, all on the same morning.
That disagreement isn't a defect. Each number answers a different question, with different accuracy, and knowing which to trust for which decision is most of the game. This guide compares all three properly: what each one actually measures, how accurate the measuring tools really are (smart-scale honesty included), the "skinny fat" blind spot that fools BMI, why the humble tape measure outperforms far fancier metrics for health risk, and the simple monthly routine that beats obsessing over any single figure. Check your own baseline as you read with our free BMI calculator.
What Each Number Actually Measures
| BMI | Body fat % | Waist size | |
|---|---|---|---|
| What it is | Weight ÷ height² (kg/m²) | Share of body mass that is fat | Circumference at navel level |
| What it captures | Overall mass for your height | Composition: fat vs everything else | Central (visceral) fat storage |
| Blind spot | Can't tell muscle from fat | Says nothing about where fat sits | Ignores total mass and fitness |
| Best for | Fast screening, population stats | Training/body-recomposition progress | Metabolic risk check |
| Cost to measure | Free, exact inputs | Free-ish to $150 (method-dependent) | A $2 tape measure |
| Healthy zone (adults) | 18.5–24.9 (WHO standard) | ~10–20% men, ~18–28% women | < half your height |
BMI is pure arithmetic — which is its strength (instant, objective, comparable across studies) and its weakness (a 5'9" person weighing 200 lb computes to BMI 29.5 whether that mass is muscle or fat). It was designed to describe populations, and at that job it's genuinely good; the trouble starts when one person treats it as a verdict. If you want the full picture of what BMI can and can't tell you — including the healthy weight ranges per height — our healthy weight guide covers it in depth.
Body fat percentage is what most people actually mean when they say they want to "lose weight" — nobody wants to lose muscle or bone. Two people at identical BMI can differ by 15 percentage points of body fat, which is a different body and a different risk profile.
Waist circumference looks like the crudest of the three and is arguably the most medically useful, because it targets the fat that matters most — more on that below.
How Accurate Are the Tools? An Honest Audit
A number is only as good as its measurement. Here's the honest hierarchy:
| Method | Typical error | Cost / access | Notes |
|---|---|---|---|
| DEXA scan | ≈ ±1–2 pts | $50–150 per scan, clinics | The practical reference standard; also shows fat distribution and bone |
| Hydrostatic / BodPod | ≈ ±2–3 pts | Universities, some gyms | Accurate but inconvenient |
| Skinfold calipers | ≈ ±3–5 pts | $15, skill required | Consistency depends heavily on the tester; great for self-trends |
| Smart scale (BIA) | ≈ ±3–5 pts, hydration-sensitive | Built into many scales | Single readings unreliable; trends under identical conditions usable |
| Tape measure (waist) | ≈ ±1–2 cm with consistent technique | $2 | The accuracy-per-dollar champion |
The smart-scale row deserves emphasis because millions of bathrooms now have one: bioelectrical impedance (BIA) estimates body fat by running a tiny current through you, and the result swings with hydration, meals, exercise, and even foot calluses. A morning-vs-evening difference of 3+ percentage points is normal. That doesn't make the scale useless — it makes it a trend instrument: same time of day, same conditions, judge the four-week direction and ignore any single day's melodrama.
Notice what this table does to the three-way contest: body fat percentage is the most meaningful number and the least reliably measured one at home. BMI has zero measurement error but limited meaning. The tape measure sits in the sweet spot — cheap, consistent, and pointed at the right target.
The "Skinny Fat" Blind Spot
Here's the case that breaks BMI quietly. Take someone 5'9" and 150 lb: BMI 22.1, comfortably "healthy." If that person carries little muscle — common after years of dieting without strength training, or simply with age — their body fat can sit at 28% or higher. Normal weight, high fat, low muscle: the pattern informally called "skinny fat" (researchers say normal-weight obesity).
It matters because metabolic risk follows fat — especially visceral fat — not body weight. Studies of normal-weight obesity link it to elevated cardiovascular and metabolic risk despite the reassuring BMI. And it's invisible to the bathroom scale by definition: the scale is the instrument saying everything's fine.
The tells are simple: a "healthy" BMI alongside a waist measurement creeping past half your height, low strength, or a body-fat estimate well above range. The response is equally unglamorous — strength training and adequate protein to rebuild the muscle side of the ratio, rather than further weight loss, which often makes the composition worse. This is the single clearest example of why one number lies and two numbers tell the truth.
Why the Tape Measure Wins on Health Risk
Fat isn't one tissue. Subcutaneous fat (under the skin, on hips and thighs) is metabolically fairly quiet. Visceral fat — packed around the liver and organs — is the kind that drives insulin resistance, blood pressure, and cardiovascular risk. Two bodies with identical body-fat percentages can carry very different visceral shares, and the waistline is where the visceral share shows up.
That's why waist thresholds appear in nearly every clinical risk screen: above 40 in / 102 cm (men) or 35 in / 88 cm (women) flags elevated risk, with lower cutoffs (~90/80 cm) for South Asian populations. The height-adjusted version is even simpler and increasingly supported by research as a better single screen than BMI: keep your waist below half your height — under 34.5 in if you're 5'9", under 36 in at 6'0".
Technique matters for consistency: measure at navel level, tape snug but not compressing, at the end of a relaxed exhale, before breakfast. Same landmark every time — the goal is a number you can compare month to month, not a flattering one.
Three People, Similar BMI, Different Stories
The lifter. 5'9", 200 lb — BMI 29.5, technically near "obese." Body fat 14%, waist 33 in. Every metric beyond BMI says excellent condition; BMI alone would send this person to a diet they don't need.
The desk worker. 5'9", 200 lb — the identical BMI 29.5. Body fat 30%, waist 41 in. Here the BMI flag is correct, and the waistline over the 40-inch threshold marks genuine metabolic risk. Same height, same weight, same BMI — opposite realities.
The dieter. 5'9", 150 lb — BMI 22.1, the "healthiest" number of the three on paper. Years of cardio-plus-calorie-cutting without strength work: body fat 28%, waist 36 in — over half of height. This is the skinny-fat pattern the scale will never catch.
One ratio, three completely different bodies. The fix isn't a better single number — it's the cheap combination: BMI and waist catches all three of these cases correctly, and adding a body-fat trend settles anything left ambiguous.
The Simple Routine That Beats All Three
Weekly: weigh-ins, averaged. Two to four mornings a week, identical conditions, and judge only the weekly average — daily weight noise is ±2–4 lb of water and timing.
Monthly: the waist. Same landmark, same technique. This is your risk dial; it's also the best progress marker during body recomposition, when the scale often refuses to move while your composition improves.
Monthly-ish: body fat, same method only. If you use a BIA scale or calipers, compare readings only against the same tool under the same conditions. Never compare your smart scale's 24% to a DEXA's 20% — cross-method comparisons are noise wearing a lab coat.
Yearly: the numbers that actually adjudicate. Blood pressure, fasting glucose or HbA1c, and lipids at your physical. Every proxy in this article exists to predict these; when proxies and labs disagree, the labs win.
And a framing note that applies to all of it: direction beats level. A waist going from 40 to 38 inches is better news than a static 36; a body-fat trend drifting down under consistent conditions is real even if the absolute number is off by three points. Small sustained changes matter — losing even 5–10% of body weight measurably improves blood pressure, blood sugar, and cholesterol, as covered in our healthy weight guide.
Frequently Asked Questions
Which is more important: BMI or body fat percentage?
Different jobs: BMI screens fast; body fat describes composition. For personal decisions, composition plus a waist measurement beats BMI — but BMI plus waist is the best cheap combination, and it's what our calculator gives you in thirty seconds.
What is a healthy body fat percentage?
Roughly 10–20% for men and 18–28% for women, rising modestly with age; athletes run lower. Essential minimums are ~3–5% (men) and ~10–13% (women). Ranges are orientation, not verdicts — measurement error spans several points.
Are smart scale body fat readings accurate?
Expect ±3–5 percentage points and strong sensitivity to hydration and timing. Use them for trends under identical conditions, never for absolute truth or cross-device comparisons.
What does "skinny fat" mean?
Normal BMI, high body fat, low muscle — e.g., 5'9"/150 lb (BMI 22) at 28% body fat. Risk follows the fat, not the weight, and the standard fix is strength training and protein rather than more weight loss.
Why is waist size such a good health indicator?
It proxies visceral fat, the metabolically active kind. Thresholds: >40 in/102 cm (men), >35 in/88 cm (women), lower for South Asian populations — or simply keep waist under half your height.
How often should I measure?
Weight a few times weekly (averaged), waist monthly, body fat monthly with one consistent method, labs yearly. Everything is a trend instrument.
Can you have a healthy BMI and still be unhealthy?
Yes — the skinny-fat pattern. And the reverse: muscular "overweight" BMIs with superb health. Pair BMI with waist (and labs) and both false verdicts disappear.
Check Your Own Numbers
Start with the two free ones. Our BMI calculator gives you the screening number and your healthy weight range for your height in seconds, metric or imperial. Then grab a tape measure, take your waist at the navel on a relaxed exhale, and divide by your height — under 0.5 is the goal. If both of those agree you're fine, you almost certainly are; if they disagree, you've just learned something a bathroom scale would never have told you, and a body-fat trend (or a conversation with your doctor) is the sensible next step.
This article is for general educational purposes only and is not medical advice, diagnosis, or treatment. Body-fat ranges and waist thresholds are screening guidelines with known measurement error and population variation. Always consult a qualified healthcare professional about your weight, body composition, or health concerns.