
BMR vs TDEE: the short answer
BMR is the energy your body burns at complete rest, purely keeping you alive. TDEE is everything you burn across a full day: BMR plus digestion, daily movement and exercise. TDEE is always the larger number, usually 20 to 90 per cent higher, and it is the one to plan your eating around.
Key Takeaways
- BMR is a floor, not a target — the cost of being alive and doing nothing else.
- TDEE is BMR multiplied by an activity factor, and it is the figure you actually eat to.
- BMR is normally 60 to 70 per cent of TDEE; the rest is movement and digestion.
- Eating at your BMR is a common and counterproductive mistake: for many people it is a 30 to 40 per cent deficit they never intended.
- Mifflin-St Jeor is the standard equation; Harris-Benedict reads a few per cent high; Katch-McArdle suits people who know their body fat.
- Every equation is an estimate with real error bars, so treat the output as a starting point.
Fitness apps and forum posts use the two terms almost interchangeably, and that confusion has a cost. Take a BMR figure, eat to it thinking it is your daily requirement, and you have quietly signed up for a much harder diet than you agreed to.
What BMR actually measures
Basal metabolic rate is the energy your body uses to stay alive while doing nothing: breathing, circulating blood, holding temperature, running the brain, repairing cells. All of it costs energy whether or not you get out of bed.
The clinical definition is strict — a twelve-hour fast, lying still and awake in a thermally neutral room, measured by indirect calorimetry. Almost nobody has that done. A calculator gives you an estimate from a regression equation built on other people's measurements, and that distinction matters later.
What drives your BMR
- Lean body mass. Muscle, organs and bone are metabolically active tissue, and this is the biggest single driver. It is why two people at the same weight can differ noticeably.
- Body size and age. More tissue to maintain means a higher BMR; the figure drifts down through adult life as lean mass declines.
- Sex. Men on average carry more lean mass at the same height and weight, which is why every equation has separate constants.
- Hormones and health. Thyroid function has a real effect, as do fever, pregnancy, some medications and some chronic conditions.
You will also see RMR, resting metabolic rate, measured under looser conditions and roughly 5 to 10 per cent higher. In practice the two are treated as the same thing, and the gap is smaller than the error in the estimate.
What TDEE adds on top
Total daily energy expenditure is the whole picture, and it splits into four parts.
- BMR — the resting cost above, roughly 60 to 70 per cent of the total.
- TEF (thermic effect of food) — digesting and storing what you eat, around 10 per cent of calories consumed. Protein costs more to process than fat or carbohydrate.
- NEAT (non-exercise activity thermogenesis) — walking, standing, cooking, carrying things, doing your job. The most variable component between people, and where a warehouse worker and an office worker genuinely diverge.
- EAT (exercise activity thermogenesis) — deliberate training, usually a smaller slice than people expect.
NEAT and EAT are impractical to measure directly, so the standard approach is to estimate BMR and multiply by an activity factor. The multipliers are blunt, but they are the best simple tool available.
| Activity level | What it looks like in practice | Multiplier | TDEE if BMR is 1,375 kcal |
|---|---|---|---|
| Sedentary | Desk job, little or no deliberate exercise | 1.2 | ~1,650 kcal |
| Lightly active | Light exercise 1-3 days a week | 1.375 | ~1,890 kcal |
| Moderately active | Moderate exercise 3-5 days a week | 1.55 | ~2,130 kcal |
| Very active | Hard exercise 6-7 days a week | 1.725 | ~2,370 kcal |
| Extremely active | Physical job, or two training sessions a day | 1.9 | ~2,610 kcal |
Most people overestimate here. Three gym sessions a week on top of a desk job is lightly to moderately active, not very active. If unsure, pick the lower band. What TDEE is and how to calculate it covers the multipliers in more detail.
Side by side: the same person, two very different numbers
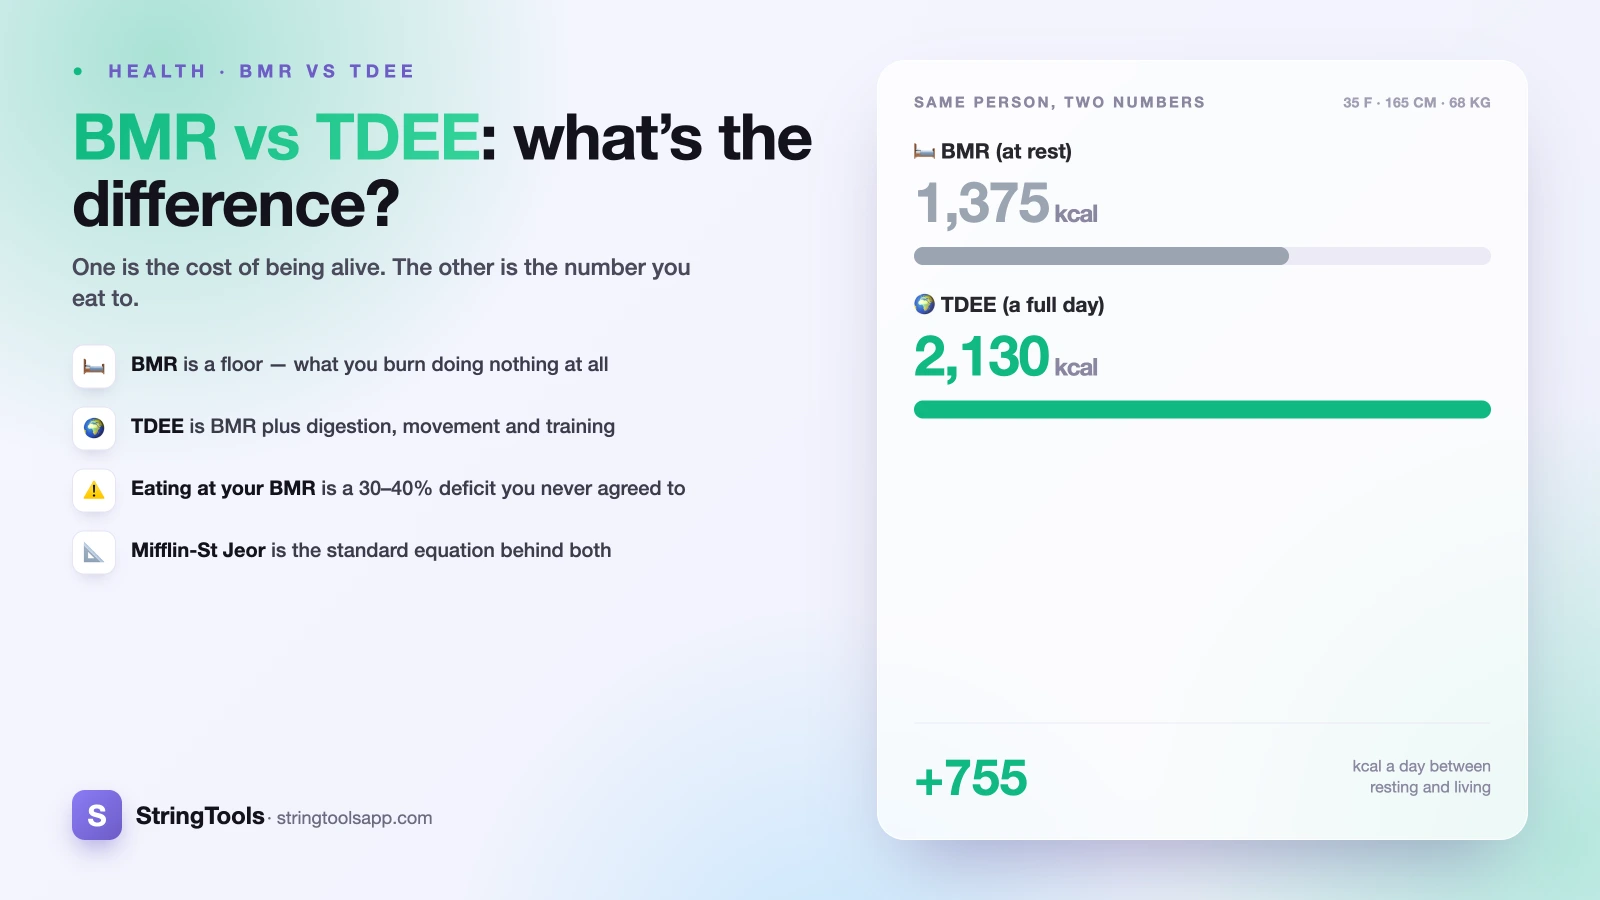
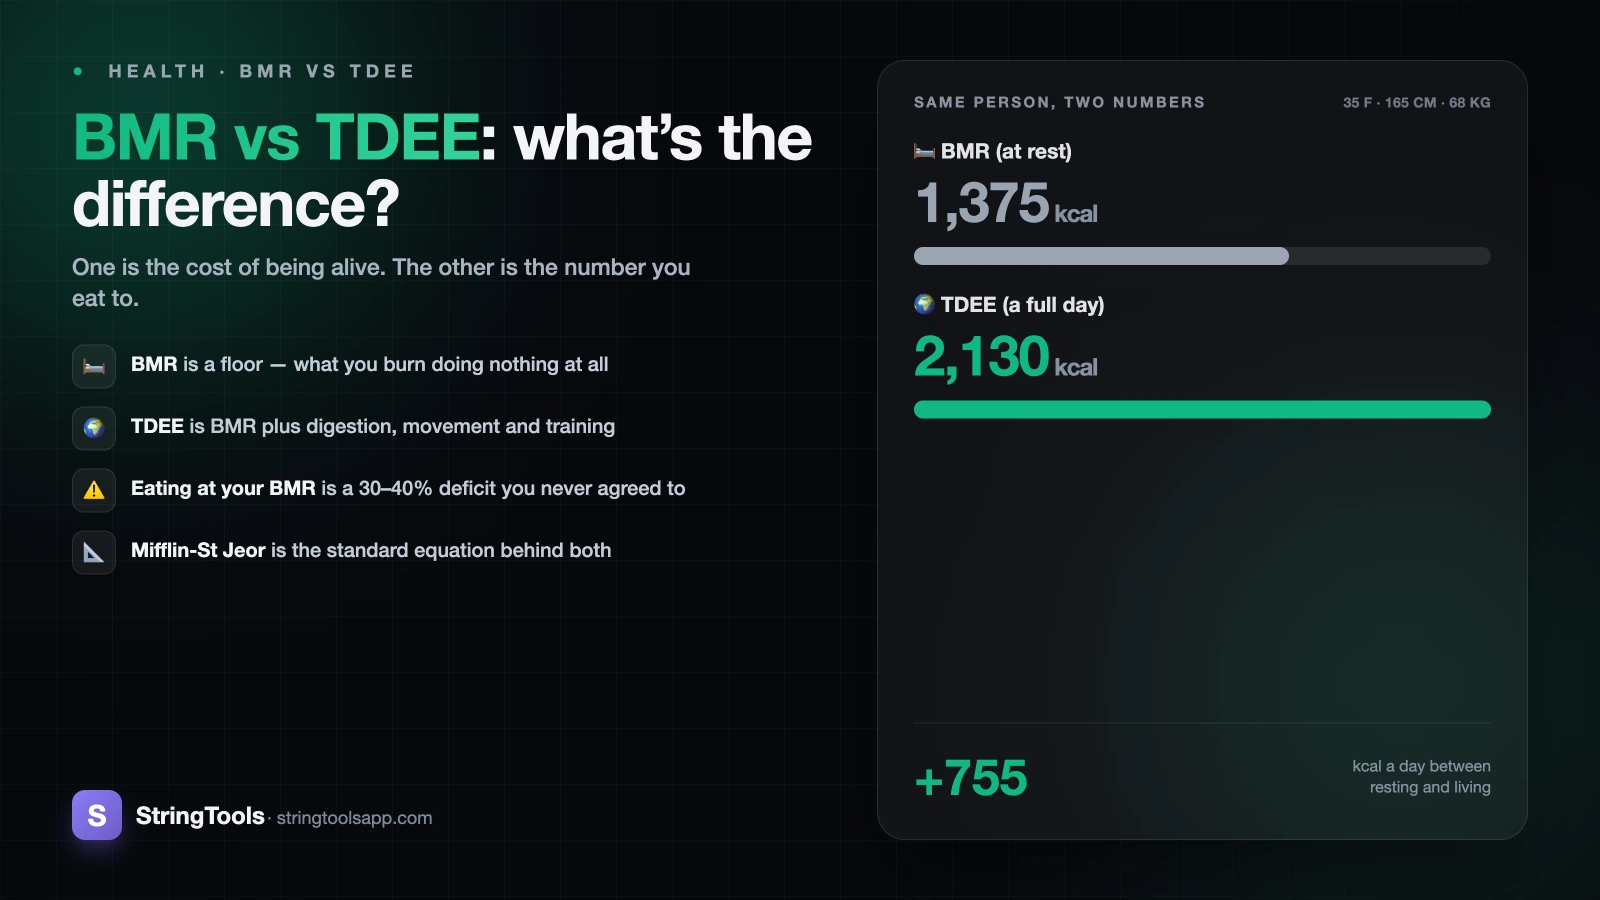
Take one example and carry her through the rest of this post: a 35-year-old woman, 165 cm, 68 kg, exercising moderately three to five days a week. Her BMR by Mifflin-St Jeor is about 1,375 kcal, her TDEE about 2,130 kcal.
| Feature | BMR | TDEE |
|---|---|---|
| What it measures | Energy to keep the body running at complete rest | Total energy burned across a full 24 hours |
| What it includes | Breathing, circulation, brain, organ and cell maintenance | BMR plus digestion, daily movement and exercise |
| How it is obtained | Indirect calorimetry after a 12-hour fast, or an equation | BMR estimate multiplied by an activity factor |
| Value for our example person | ~1,375 kcal | ~2,130 kcal |
| Share of daily burn | ~60-70% of TDEE | 100% |
| Changes when | Weight, lean mass, age or hormones change | All of the above, plus how much you move |
| Good for | A reference floor you should not routinely eat below | Setting the calorie target you eat to |
| Bad for | Setting a daily calorie target | Comparing metabolic rate between people |
The gap between those columns is 755 kcal — about a third of her daily requirement. Mixing the two up is the difference between a sustainable plan and a miserable one.
Why eating at your BMR backfires
This is the mistake worth dwelling on, because it is easy to make and rarely flagged. Someone opens a calculator, sees 1,375, reads it as "what my body needs", and eats that. What they have created is a 755 kcal daily deficit, roughly 35 per cent below their real requirement, without ever deciding to.
A sensible deficit for steady fat loss is roughly 10 to 20 per cent below TDEE — about 1,700 to 1,920 kcal here. The rule of thumb that 500 kcal a day yields roughly half a kilogram, or one pound, a week is a fair planning figure, though it flatters reality over time as expenditure falls with body mass.
What tends to go wrong at very large deficits
- Adherence collapses. Extreme restriction is a poor bet against months of ordinary life.
- Movement quietly falls. NEAT drops when intake drops, often unnoticed, so the deficit you achieve is smaller than the one on paper.
- Nutrient adequacy gets hard. Below roughly 1,200-1,500 kcal it is difficult to meet protein, calcium, iron and micronutrient needs from food alone.
- Lean mass is at risk. Rapid loss without enough protein and resistance training takes muscle too, lowering BMR and making maintenance harder afterwards.
- Sleep, mood, concentration and menstrual regularity are often affected long before the scale shows anything useful.
The floor, stated plainly
As a general guide, adults should not eat below roughly 1,200 kcal a day for women or 1,500 kcal a day for men without medical supervision. For many people, particularly shorter or lighter adults, the calculated BMR sits close to or below those figures, which is exactly why BMR makes a poor target.
Eating below your BMR for an extended period is not something to do on your own. Very-low-calorie approaches exist clinically, but they are supervised by a doctor or registered dietitian, with monitoring attached. If you have a medical condition, a history of disordered eating, are pregnant or breastfeeding, or are under 18, speak to a healthcare professional before setting any calorie target. The NHS Live Well pages and the Dietary Guidelines for Americans are sound general starting points, but neither replaces individual clinical input.
None of this is about willpower, and no food needs to be earned or apologised for. A target built on the wrong number simply will not do what you hoped.
The three BMR equations, and when each is appropriate
Every calculator runs one of three formulas. Knowing which is under the bonnet explains why two apps give you different answers.
Mifflin-St Jeor (1990) — the current standard
BMR (men) = 10 × kg + 6.25 × cm - 5 × age + 5
BMR (women) = 10 × kg + 6.25 × cm - 5 × age - 161
This is the default in reputable calculators and the one dietetic guidance generally points to for healthy adults. It came from a more modern, more representative sample than its predecessor and lands closer to measured values. Use it unless you have a reason not to.
Harris-Benedict (1919, revised 1984) — the older one
BMR (men) = 88.362 + 13.397 × kg + 4.799 × cm - 5.677 × age
BMR (women) = 447.593 + 9.247 × kg + 3.098 × cm - 4.330 × age
The original dates from 1919 and was revised by Roza and Shizgal in 1984. Much older fitness literature is built on it, and it reads a few per cent higher than Mifflin-St Jeor. If a calculator hands you a suspiciously generous number, this is often why.
Katch-McArdle — when you know your body fat
Lean body mass (kg) = weight in kg × (1 - body fat % / 100)
BMR = 370 + 21.6 × lean body mass in kg
It ignores height, age and sex entirely and works from lean mass alone, on the logic that lean tissue is what burns the energy. With a trustworthy body-fat figure from a DEXA scan or skilled calipers it can be the most accurate of the three, and it suits very lean or very muscular people, where the height-and-weight equations underestimate. The catch is the input: bathroom-scale bioimpedance can be out by several percentage points, and that error carries straight through.
| Equation | Published | Inputs needed | Best suited to | Main weakness |
|---|---|---|---|---|
| Mifflin-St Jeor | 1990 | Sex, age, height, weight | Almost everyone; the sensible default | Less reliable at extremes of body composition |
| Harris-Benedict (revised) | 1919, revised 1984 | Sex, age, height, weight | Matching an older source or legacy app | Reads roughly 4-5% high versus Mifflin-St Jeor |
| Katch-McArdle | Popularised 1996 | Weight and body fat percentage | Lean or muscular people with a real body-fat figure | Only as accurate as the body-fat input |
One equation will not rescue a bad activity multiplier. The formula typically moves your BMR by 3 to 6 per cent; choosing sedentary instead of moderately active moves your TDEE by nearly 30 per cent. Spend your attention accordingly.
Working through the numbers yourself
Here is the arithmetic for the example person, so you can follow the same steps with your own figures.
Step 1 — BMR, Mifflin-St Jeor. Female, 68 kg, 165 cm, 35 years old.
(10 × 68) + (6.25 × 165) - (5 × 35) - 161 = 680 + 1,031.25 - 175 - 161 = 1,375 kcal
Step 2 — the same person, Harris-Benedict.
447.593 + (9.247 × 68) + (3.098 × 165) - (4.330 × 35) = 1,436 kcal
About 61 kcal higher, or roughly 4 per cent. That is the typical gap.
Step 3 — the same person, Katch-McArdle. At 28 per cent body fat her lean mass is 48.96 kg and BMR lands near 1,428 kcal; at 32 per cent it is 46.24 kg and about 1,369 kcal. Four points of body fat move the answer by roughly 60 kcal, which tells you how much to trust a guessed input.
Step 4 — TDEE. Multiply by the activity factor. Moderately active, 1.55: 1,375 × 1.55 = 2,131 kcal.
Step 5 — set a target. Eat around TDEE to maintain. For gradual fat loss take 10 to 20 per cent off, about 1,700 to 1,920 kcal. To gain gradually, add roughly 10 per cent. Do not go below the floors above.
The calorie calculator runs all of this in the browser, including the choice of equation. For target-setting in depth see how many calories should I eat a day; the BMI calculator is a separate, cruder screening measure that says nothing about energy needs.
Treat the number as a hypothesis, then test it
The equations are population averages. Two people with identical height, weight, age and sex can have measured resting rates differing by a few hundred calories, and no height-and-weight formula can see that. Mifflin-St Jeor generally lands within about 10 per cent of measured resting rate in healthy adults — and 10 per cent of a 2,100 kcal TDEE is 210 kcal. So do not treat the output as a measurement. Treat it as a hypothesis and let your own data correct it.
A practical two-week check
- Eat at your calculated target consistently for two full weeks. One good week is not enough signal.
- Weigh under the same conditions each time and use the weekly average, never a single day. Day-to-day swings are mostly water, glycogen and gut contents.
- Compare week one's average against week two's — a stable average means your estimate is close to maintenance. If weight is moving faster or slower than intended, adjust by 100 to 200 kcal and give it another two weeks.
- Recalculate after every 5 kg or so of change. A lighter body costs less to run, so a target that worked at the start will eventually stall.
- Track energy, sleep, training performance, hunger and mood alongside the scale. If those are deteriorating, the deficit is too large whatever the arithmetic says.
Weekly averages move body weight; one large meal does not undo a week. If you are managing a health condition, taking medication that affects appetite or metabolism, or working through a history of disordered eating, get an individual plan from a doctor or registered dietitian rather than a calculator — the NIH's NIDDK publishes plain-language material on weight and metabolism worth reading first.
The short version: BMR tells you what your body costs at rest, TDEE tells you what your day costs, and only one of them is a sensible thing to eat.
Frequently Asked Questions
Should I eat my BMR or my TDEE?
Your TDEE, adjusted for your goal. BMR is the energy cost of lying still all day and accounts for nothing you actually do, so eating to it usually creates a much steeper deficit than intended, often 30 to 40 per cent below your real needs. Eat around TDEE to maintain weight, roughly 10 to 20 per cent below it for gradual fat loss, and around 10 per cent above it to gain.
Is it dangerous to eat below your BMR?
For a short period it is not automatically harmful, but doing it routinely is not advisable without medical supervision. Sustained intake well below your resting requirement makes it hard to meet protein and micronutrient needs, raises the risk of losing lean mass, and commonly affects sleep, mood, concentration and menstrual regularity. As a general guide, do not go below roughly 1,200 kcal a day for women or 1,500 for men unless a doctor or registered dietitian is supervising you.
Which BMR formula is the most accurate?
For most healthy adults, Mifflin-St Jeor is the best general-purpose choice and the default in reputable calculators. With a reliable body-fat measurement from a DEXA scan or a skilled assessor, Katch-McArdle can be more accurate, particularly for lean or muscular people. Harris-Benedict is the older equation and tends to read roughly 4 to 5 per cent higher. All three are estimates with meaningful error, so verify against your own results over a few weeks.
What percentage of TDEE is BMR?
Usually around 60 to 70 per cent for a typical adult. Digestion accounts for roughly 10 per cent of the calories you eat, and the remainder comes from everyday movement and deliberate exercise. The more physically active you are, the smaller a share BMR represents — for someone with a physical job it might be closer to half the daily total.
Why do different calculators give me different BMR numbers?
Almost always because they use different equations. Mifflin-St Jeor, the revised Harris-Benedict and Katch-McArdle can differ by 3 to 6 per cent on the same person. Some calculators also report RMR rather than BMR, which runs roughly 5 to 10 per cent higher because it is measured under looser conditions. Larger differences in the final daily figure usually come from the activity multiplier, not the formula.
Does BMR go down when you diet?
Yes, for two reasons. Losing weight means less tissue to maintain, so the equations themselves return a lower number, and prolonged restriction produces some additional downward adjustment beyond what weight loss alone explains. This is a normal physiological response, not a broken metabolism. In practice it means recalculating after every 5 kg or so of change and expecting to need a smaller deficit as you get lighter.
Sources and references
NHS Live Well (nhs.uk) · Dietary Guidelines for Americans (dietaryguidelines.gov) · NIH's NIDDK (niddk.nih.gov). Content was reviewed against these sources as of the last-updated date above; external figures and rules may change after publication.