
Gross Margin Is the Start, Net Margin Is the End
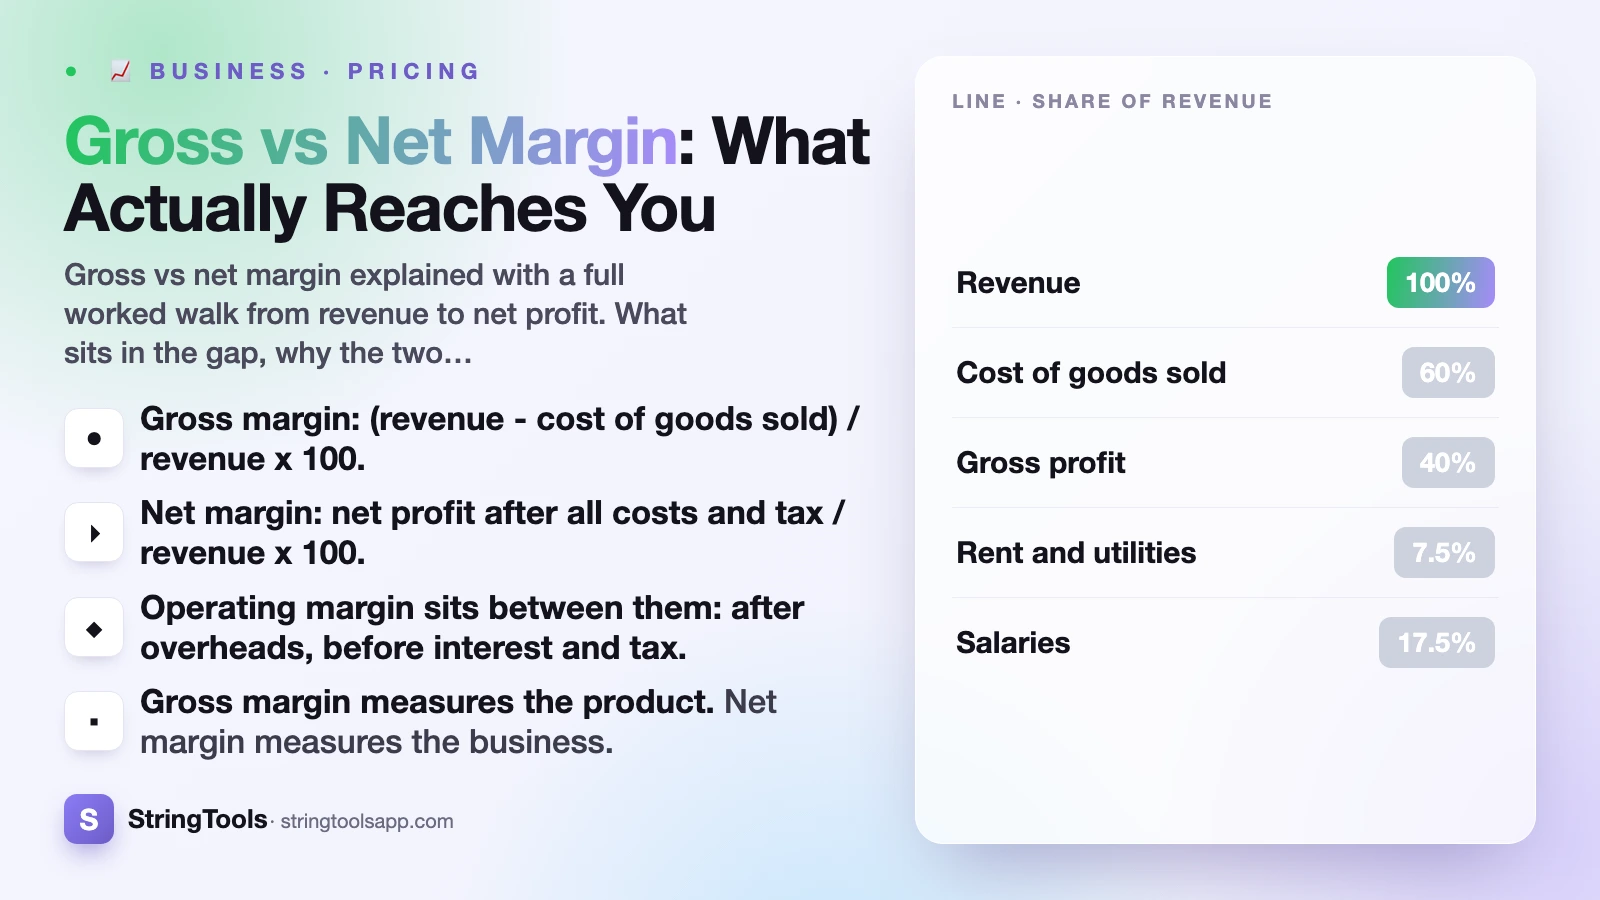
Gross margin is revenue minus the direct cost of what you sold, as a share of revenue. Net margin is what survives after every other cost — overheads, salaries, selling fees, interest and tax. A business running a 40% gross margin can easily end at a 5% net margin, because everything that is not the product sits between the two figures.
Key Takeaways
- Gross margin:
(revenue - cost of goods sold) / revenue x 100. - Net margin:
net profit after all costs and tax / revenue x 100. - Operating margin sits between them: after overheads, before interest and tax.
- Gross margin measures the product. Net margin measures the business.
- The gap is your fixed costs, and it stays roughly the same size as revenue grows.
- Many calculators show gross margin only. The profit margin calculator also nets off selling fees, but no calculator can produce a true net margin without your overheads and tax.
Both numbers are useful and they answer different questions. Gross margin tells you whether the thing you sell is worth selling. Net margin tells you whether the company around it is worth running.
The Full Walk From Revenue to Net
Here is an illustrative year for a small product business. Every line is expressed as a share of revenue so the erosion is visible.
| Line | Amount | Share of revenue |
|---|---|---|
| Revenue | 240,000 | 100% |
| Cost of goods sold | 144,000 | 60% |
| Gross profit | 96,000 | 40% |
| Rent and utilities | 18,000 | 7.5% |
| Salaries | 42,000 | 17.5% |
| Software and services | 6,000 | 2.5% |
| Marketing | 12,000 | 5% |
| Operating profit | 18,000 | 7.5% |
| Interest on borrowing | 3,000 | 1.25% |
| Profit before tax | 15,000 | 6.25% |
| Tax at an illustrative 20% | 3,000 | 1.25% |
| Net profit | 12,000 | 5% |
Forty percent at the top, five percent at the bottom. Thirty-five points of revenue disappeared into costs that have nothing to do with the product itself.
Read the table as a sequence of questions. Is the product profitable — yes, 40%. Is the operation profitable once the lights are on and the staff are paid — yes, but only 7.5%. Is the company profitable after financing and tax — yes, 5%.
The tax rate here is purely illustrative and chosen to keep the arithmetic simple. Real rates vary by country, entity type and profit level, and tax is calculated on taxable profit rather than on the accounting figure. Your tax authority is the reference for that: the IRS small business and self-employed pages for the US, and GOV.UK's guidance on working for yourself for the UK.
What Sits Between the Two Figures
Everything in the gap falls into one of four groups, and telling them apart is what makes the numbers actionable.
Operating overheads
Rent, salaries, insurance, software, professional fees, the baseline marketing you would run regardless. These are largely fixed: they do not rise when you sell one more unit. That is what makes them dangerous in a bad month and wonderful in a good one.
Selling costs that scale
Payment processing, marketplace commission, shipping to the customer, packaging consumables. These behave like cost of goods sold because they rise with every sale, but they are conventionally reported below the gross line. If you sell through a platform, this group can be large enough that gross margin becomes actively misleading — what marketplace fees do to your margin takes that case apart.
Financing
Interest on loans, overdrafts and finance agreements. This is a cost of how the business is funded, not of what it sells, which is why operating margin deliberately excludes it. Two identical businesses with different borrowing will have the same operating margin and different net margins.
Tax
Calculated on taxable profit, which is not the same as the accounting profit in your management reports. Depreciation rules, allowable expenses and reliefs all move it.
Separating these matters because they respond to different actions. A thin net margin caused by overheads is a cost-structure problem. One caused by interest is a balance-sheet problem. One caused by selling fees is a pricing problem.
The Three Margins and What Each Is For
| Margin | Formula | What it tells you | What it ignores |
|---|---|---|---|
| Gross | (revenue - COGS) / revenue | Whether the product itself earns | Every fixed cost |
| Operating | operating profit / revenue | Whether the operation earns | Financing and tax |
| Net | net profit / revenue | Whether the company earns | Nothing |
Using the figures from the walk above: 40% gross, 7.5% operating, 5% net.
Gross margin is the right tool for product decisions. Should we stock this line, is this price high enough, which item earns most per sale — all gross-margin questions, because fixed costs do not change with the answer.
Operating margin is the right tool for judging the business as a machine, independent of how it is financed. It is the comparison to make against a competitor, because it strips out the noise of who borrowed what.
Net margin is the right tool for owners. It is the share of every unit of revenue that ends up available to reinvest or distribute, and it is the only one of the three that has already paid for everything.
Quoting the wrong one is common and rarely innocent. A margin figure without a label is not information.
Why Gross and Net Move Differently
The two margins respond to completely different things, and watching how they diverge diagnoses the problem quickly.
Gross margin falls when supplier costs rise, when you discount, or when your sales mix shifts toward thinner products. It is a product-level signal and it moves with every sale.
Net margin falls for all of those reasons plus one more: fixed costs growing faster than revenue. A business can hold its gross margin perfectly steady at 40% and watch net margin slide from 5% to nothing simply by hiring, moving to a bigger space or adding software.
The reverse is the case for operational leverage. Because the fixed costs in the gap are broadly flat, extra revenue arrives at close to the gross margin rate and drops almost entirely to the bottom line. Take the example business and add 60,000 of revenue at the same 40% gross margin with unchanged overheads: gross profit rises by 24,000, operating profit goes from 18,000 to 42,000, and operating margin jumps from 7.5% to 14%. Revenue grew by a quarter and operating profit more than doubled.
That effect works just as hard in reverse. A quarter off revenue takes operating profit from 18,000 to a loss. Thin net margins are not just small, they are fragile, which is the real argument for keeping fixed costs lower than feels necessary.
Reading the Two Margins Together
Neither figure is very informative alone. Read as a pair they point straight at the problem.
| Gross | Net | What it usually means | Where to look first |
|---|---|---|---|
| High | High | The product earns and the overheads are contained | Protect it; watch fixed costs as you grow |
| High | Low | The product is fine, the business around it is expensive | Overheads, headcount, selling fees, interest |
| Low | Low | The price is too close to the cost | Pricing, supplier costs, discounting, mix |
| Low | High | Thin margins carried by very high volume and low overheads | Volume risk; a small drop in sales hurts fast |
The high-gross, low-net combination is the most common and the most frustrating, because every product report looks healthy while the bank balance does not move. It is also the most fixable, since overheads are within your control in a way that supplier prices often are not.
The low-gross, low-net case is the urgent one. If the product barely earns, no amount of overhead trimming rescues it, and selling more units makes the position worse rather than better. That is a pricing conversation, not a cost-cutting one.
The practical habit is to write both numbers, with their labels, at the top of every monthly review. Two figures and a date take a minute to produce and make a year of drift visible at a glance.
Working Out Your Own Two Numbers
You do not need accounting software to do this, only a consistent definition applied twice.
For gross margin, total your revenue for a period and total the direct cost of everything you sold in that period. Direct cost means materials, wholesale price, inbound shipping and duty, packaging and the labour that goes into making or packing the item. Subtract, divide by revenue, multiply by a hundred. The profit margin calculator does this per product and blends it across your whole range, weighting by volume rather than averaging the percentages.
For net margin, keep going. Subtract every operating cost, then interest, then tax, and divide the remainder by the same revenue figure.
Three things go wrong most often.
Costs land on the wrong side of the line. Shipping to a customer is a selling cost, not a cost of goods. Your own salary is an overhead if you pay yourself a wage. Consistency matters more than getting the convention exactly right, because the point is to compare periods.
The period does not match. Revenue for a quarter measured against costs for a month gives a nonsense margin. Both halves must cover the same dates.
Stock movement is ignored. Cost of goods sold is what you sold, not what you bought. If you bought heavily and sold lightly, using purchases instead of cost of sales will understate your gross margin badly.
If your net margin is thin, the fix depends on where the money went. What is a good profit margin sets out the fixed-cost test that tells you whether the gross margin is even large enough to work, and margin vs markup covers the pricing error that quietly holds gross margin below where you think it is.
This is general business information, not accounting or tax advice. Definitions of cost of goods sold, allowable expenses and taxable profit vary by country and entity type, and an accountant is the right person to apply them to your accounts.
Frequently Asked Questions
What is the difference between gross and net margin?
Gross margin is revenue minus the direct cost of goods sold, divided by revenue. Net margin is what is left after overheads, selling costs, interest and tax, divided by the same revenue. In the worked example above, 40% gross becomes 5% net.
How do you calculate net profit margin?
Net profit margin is net profit after all costs and tax / revenue x 100. With revenue of 240,000 and net profit of 12,000, that is 5%. The same revenue figure must be used as the denominator for gross, operating and net margin so the three are comparable.
What is operating margin and where does it fit?
Operating margin sits between the two: gross profit minus operating overheads, before interest and tax. In the example it is 18,000 on 240,000, or 7.5%. It is the fairest way to compare two businesses, because it ignores how each one is financed.
Why is my net margin so much lower than my gross margin?
Because everything that is not the product sits in the gap: rent, salaries, software, marketing, interest and tax. That gap is largely fixed, so it eats a bigger share of revenue when sales are low and a smaller share when sales are high.
Do marketplace and payment fees come out of gross or net margin?
Conventionally they sit below the gross line as selling costs, so they reduce net margin rather than gross margin. If those fees are a large share of your price, gross margin will look healthy while the money that reaches you does not, so track both.
Which margin should I use to price a product?
Gross margin, because fixed costs do not change with the pricing decision. Set a gross margin target that is large enough to cover your fixed costs at your expected volume, then check the net figure once a year to confirm the target is still high enough.
Sources and references
IRS small business and self-employed pages (irs.gov) · GOV.UK's guidance on working for yourself (gov.uk). Content was reviewed against these sources as of the last-updated date above; external figures and rules may change after publication.