
There Is No Universal Good Margin
A good profit margin is whichever margin covers your fixed costs at the volume you actually sell, and leaves a return worth the risk. There is no universal number. A 15% margin can be excellent and a 70% margin can be a failing business, because margin percentage says nothing about volume, overheads, inventory risk or how much capital is tied up.
Key Takeaways
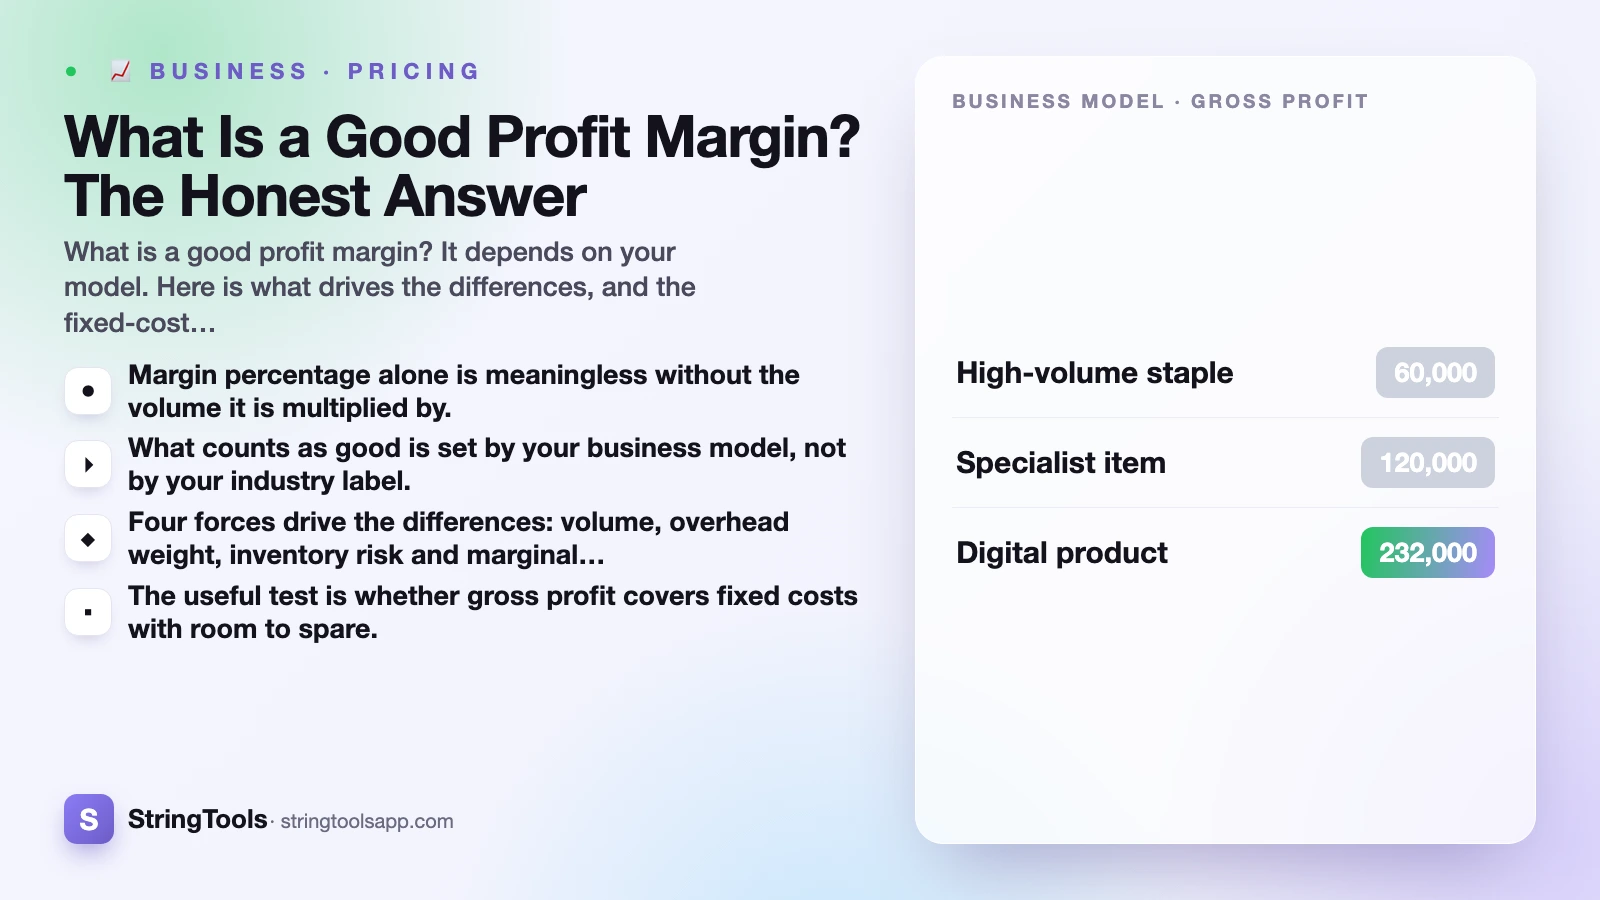
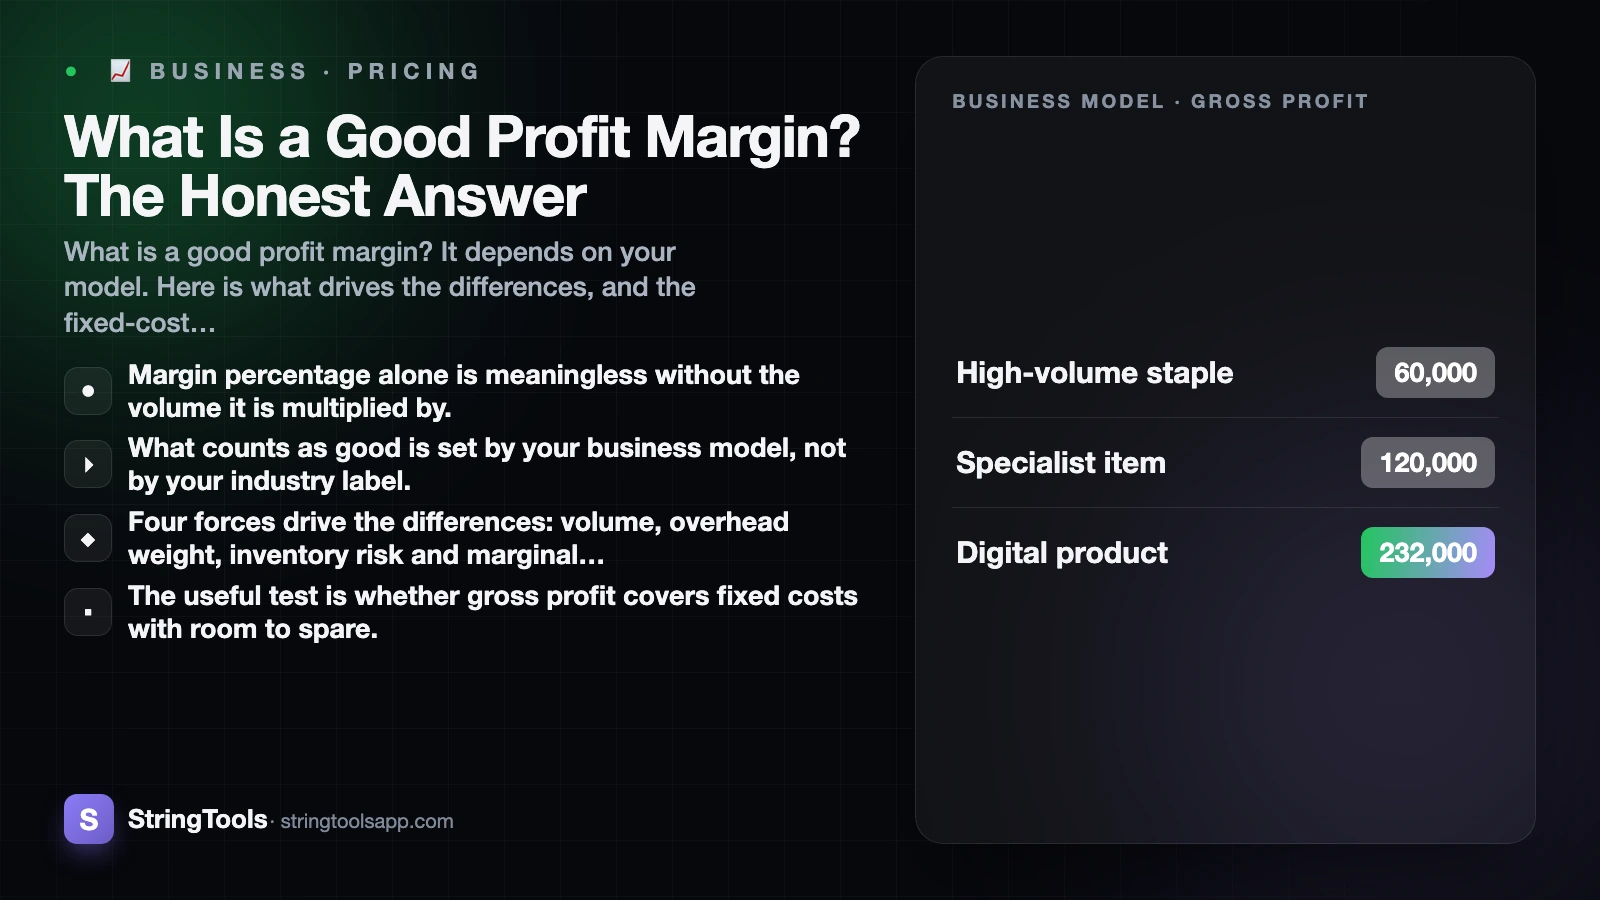
- Margin percentage alone is meaningless without the volume it is multiplied by.
- What counts as good is set by your business model, not by your industry label.
- Four forces drive the differences: volume, overhead weight, inventory risk and marginal cost.
- The useful test is whether gross profit covers fixed costs with room to spare.
- Compare your own margin over time and across products, not against a borrowed benchmark.
- Gross margin is not profit. Rent, wages, interest and tax still come out of it.
If you came here for a number to aim at, the honest answer is that anyone who gives you one without asking about your model is guessing. What follows is the structure that produces a number for your business specifically.
Why the Same Percentage Means Different Things
Three illustrative businesses, all viable, all with completely different margins.
| Business model | Unit cost | Price | Gross margin | Units a year | Gross profit |
|---|---|---|---|---|---|
| High-volume staple | 1.70 | 2.00 | 15% | 200,000 | 60,000 |
| Specialist item | 200.00 | 500.00 | 60% | 400 | 120,000 |
| Digital product | 1.00 | 30.00 | 96.7% | 8,000 | 232,000 |
The staple has the worst margin and a perfectly healthy business, provided the volume holds and the fixed costs are modest. The specialist item has four times the margin and twice the gross profit. The digital product has an almost theoretical margin, which tells you nothing at all until you know what it cost to build and what it costs to market.
Reverse the volumes and every conclusion flips. That is the whole point: the percentage is one term in a multiplication, and quoting it alone is like quoting a speed without saying for how long.
The Four Forces That Set Your Margin
Differences between business models are not arbitrary. Four forces explain almost all of them.
Volume
The more units you sell, the less margin each one needs to carry. A business selling two hundred thousand units spreads its rent across two hundred thousand sales. A business selling four hundred spreads the same rent across four hundred. High-volume models can survive on thin margins precisely because the volume does the work.
Overhead weight
Margin exists to pay for everything that is not the product. A business with a warehouse, a delivery fleet and thirty staff needs far more gross margin per sale than one person working from a spare room, even if they sell the identical item. When somebody quotes an industry margin, what they are really quoting is that industry's typical overhead structure.
Inventory and obsolescence risk
If you buy stock that might not sell, the margin on what does sell has to pay for what does not. Fashion, seasonal goods and perishables carry high headline margins because a meaningful share of the stock is discounted or written off. Made-to-order and dropshipped models carry less of that risk and can therefore run thinner.
Marginal cost
When one more sale costs you almost nothing — software, digital downloads, most information products — gross margin approaches 100% and simply stops being a useful measure. The real costs are development and customer acquisition, both of which sit below the gross-margin line. Judging a software business on gross margin is close to meaningless, which is why those businesses talk about contribution after acquisition cost instead.
The Test That Replaces a Benchmark
Instead of asking whether your margin is good, ask whether it works. That question has an arithmetic answer.
Start with your annual fixed costs: rent, salaries including your own, insurance, software, accounting, the base level of marketing you would run regardless. Call that figure F.
Then take your gross profit per unit — price minus the full unit cost, including packaging and inbound shipping.
Divide F by gross profit per unit. That is how many units you must sell before the business makes a single unit of profit.
Worked through with the specialist item above: gross profit per unit is 300. If fixed costs are 90,000 a year, you need 300 units before you break even, and you expect to sell 400. The 100 units above break-even produce 30,000, which is your entire annual profit before tax. A 60% margin that sounded generous turns out to leave a fairly narrow buffer.
Now the staple: gross profit per unit is 0.30. The same 90,000 of fixed costs needs 300,000 units, and the business only sells 200,000 — so the 15% margin does not work at that overhead level, though it would work fine for an operation with 40,000 of fixed costs.
Same two margins, opposite verdicts, and the deciding factor was never the percentage. The break-even calculator does this arithmetic with itemised fixed costs and a sensitivity table if you want to see how far the answer moves when price or cost shifts.
Why Published Benchmarks Mislead
Industry average margins are widely quoted and rarely useful. Four reasons.
The category is too broad. "Retail" includes a corner shop, a jeweller and a wholesaler. Their models share a word and almost nothing else.
The definitions vary. One source means gross margin, another means operating margin, a third means net margin after tax. Those can differ by a factor of ten in the same business, and headlines rarely say which is which.
The mix is hidden. A reported margin for a company is a blend across products that individually range from thin to fat. Your single-product margin is not comparable to somebody's blended figure.
The sample is skewed. Published figures usually come from larger businesses that file accounts, whose scale and cost structure differ from a small operation.
If you do want to look at real aggregate data rather than a number somebody typed into a blog post, official statistics agencies publish it: the US Census Bureau's retail data programme and the Bureau of Economic Analysis are primary sources, and your own tax authority's small-business guidance — the IRS Tax Guide for Small Business, for instance — defines the terms consistently so you at least know what is being measured.
Even then, treat the result as context rather than a target. The only benchmark that genuinely applies to your business is your own margin last year.
The Comparisons That Do Work
Three comparisons are worth making, and all of them are internal.
Your own margin over time. If last year's blended margin was 42% and this year's is 37%, something specific changed — supplier costs, discounting, a shift in mix — and it is findable. A five-point drop is a concrete problem in a way that "below the industry average" never is.
Your margin across products. Sort your lines by margin and by volume. The pattern usually shows a small number of lines carrying the business and a long tail that looks busy without contributing much. Shifting sales toward the strong lines raises your blended margin without a single price change.
Your gross margin against your fixed-cost coverage. This is the ratio that decides whether you are solvent. Gross profit has to exceed fixed costs, and by enough to absorb a bad quarter.
One warning about blending. Blended margin is total gross profit divided by total revenue, never the average of the individual margins. Averaging treats a product sold four hundred times as equal to one sold two hundred thousand times, and it flatters almost every business that tries it. The profit margin calculator computes the weighted figure across multiple products and shows the simple average alongside it precisely so you can see the size of that gap.
What to Do If Your Margin Is Too Thin
If the fixed-cost test says your margin does not work, there are only four levers, and it is worth knowing which is which.
Raise the price. This moves margin faster than anything else, because the extra money has no cost attached. A small rise on a thin margin is proportionally enormous: on a 15% margin, a 5% price rise adds a third to your gross profit per unit if volume holds. Whether it holds is the question, and how to price a product works through testing that.
Cut the unit cost. Negotiate supply, buy in larger quantities, redesign the packaging, change the shipping method. Every unit of cost removed is a unit of profit added, at every volume.
Change the mix. Sell more of what already earns well. This costs nothing and is usually the fastest available move.
Cut fixed costs. This does not change the margin at all, but it lowers the bar the margin has to clear, which is the same result arrived at from the other side.
Notice what is not on the list: selling more units at a margin that does not cover costs. If gross profit per unit is below zero, volume makes things worse, not better, and no amount of growth fixes it.
A closing caution. Everything above is gross margin — revenue minus the direct cost of goods. Overheads, salaries, interest and tax all come out afterwards, and the share that finally reaches you is much smaller. Gross vs net margin walks that gap line by line, and margin vs markup covers the other way businesses routinely quote the wrong number. This is general business information, not accounting or tax advice, and an accountant is the right person to look at your actual accounts.
Frequently Asked Questions
What is a good profit margin for a small business?
There is no single figure. A good margin is one that covers your fixed costs at your actual volume and leaves a return worth the risk. Divide your annual fixed costs by your gross profit per unit: if that number of units is comfortably below what you sell, the margin works.
Is a 15% margin bad?
Not necessarily. At 200,000 units and a gross profit of 0.30 each, a 15% margin produces 60,000 of gross profit, which is fine for a business with low overheads and poor for one with 90,000 of fixed costs. The percentage only becomes meaningful once you multiply it by volume.
Why do some industries have much higher margins?
Four forces explain most of it: volume, how much overhead each sale must carry, how much unsold stock gets written off, and how much one extra sale costs to fulfil. A product with almost no cost per extra copy can carry a very high gross margin because the marginal cost is close to zero, not because it is more profitable in the end.
Should I compare my margin to an industry average?
Be careful. Published averages mix gross, operating and net margin, cover categories too broad to be comparable, and usually come from larger filing businesses. Your own margin last year, and across your own products, is a far more useful comparison.
How do I work out my blended margin across products?
Add all the gross profit, add all the revenue, then divide once. Never average the individual margins — averaging ignores volume and flatters the result, because it treats a product sold four hundred times as equal to one sold two hundred thousand times.
Does gross margin include salaries and rent?
No. Gross margin is revenue minus the direct cost of the goods only. Rent, salaries, software, marketing, interest and tax come out afterwards, which is why net margin is much smaller. This is general information rather than accounting advice.
Sources and references
US Census Bureau's retail data programme (census.gov) · Bureau of Economic Analysis (bea.gov) · IRS Tax Guide for Small Business (irs.gov). Content was reviewed against these sources as of the last-updated date above; external figures and rules may change after publication.