
Break-Even in One Line of Arithmetic
Your break-even point is the sales volume at which total revenue equals total cost. Divide your fixed costs for the period by the contribution each unit makes — its selling price minus its variable cost — and round the answer up to a whole unit. Below that number you lose money; above it you make profit.
Key Takeaways
- Break-even units = fixed costs divided by contribution per unit, where contribution per unit = price minus variable cost per unit.
- Always round the unit answer up. You cannot sell 333.33 candles, and 333 would leave a sliver of fixed cost unpaid.
- Break-even revenue = break-even units times price, so it rises slightly above the exact figure once you round up.
- To hit a profit target, add that target to fixed costs before dividing. Nothing else in the formula changes.
- If price is less than or equal to variable cost, there is no break-even point at all — more volume simply means a bigger loss.
- This is the single-product model. Real businesses have a product mix, step-fixed costs and tax, none of which this arithmetic includes.
Most owners already carry a vague sense of the number in their head: "we need a decent month". Break-even analysis replaces that with a target you can write on a whiteboard and count toward. It is the most useful piece of management accounting a small business can do in an afternoon, and it needs three inputs and one division.
The break-even calculator does the arithmetic and the sensitivity table for you, but the point of this article is that you should be able to do it on paper. A number you derived yourself is a number you will argue with, and arguing with it is where the useful decisions come from.
The Three Numbers You Need First
Everything depends on sorting your costs into two buckets correctly. Get the sorting wrong and the formula still returns an answer — a confidently wrong one.
Fixed costs
These are the costs that turn up whether you sell one unit or a thousand: rent, salaries you pay regardless of volume, insurance, software subscriptions, the accountant, loan interest. Pick a period, usually a month, and total everything for that period. Do not annualise some items and monthly others.
Variable cost per unit
This is the cost that exists only because that unit was made or sold: materials, packaging, the payment-processing fee, the postage, the piece-rate labour, the commission. The test is simple — if you did not make that sale, would this cost have happened anyway. If the answer is yes, it is fixed.
Selling price per unit
The price before tax, and after any discount you routinely give. If half your sales go out at a 20% discount, using the list price will flatter the answer. Sales tax and VAT are excluded from both price and cost, because they are collected on behalf of an authority rather than earned. Fixed vs variable costs covers the awkward middle cases — the phone bill that is part standing charge and part usage, the delivery van, the salaried person who also gets a commission.
The gap between price and variable cost is the contribution per unit, and it is the engine of the whole model. Contribution margin explains why that single number decides more of your decisions than gross profit does.
A Worked Example: A Small Candle Maker
A one-person workshop with a part-time assistant makes one product, a signature candle, and sells it for 24 before tax. Here are the fixed costs for a month:
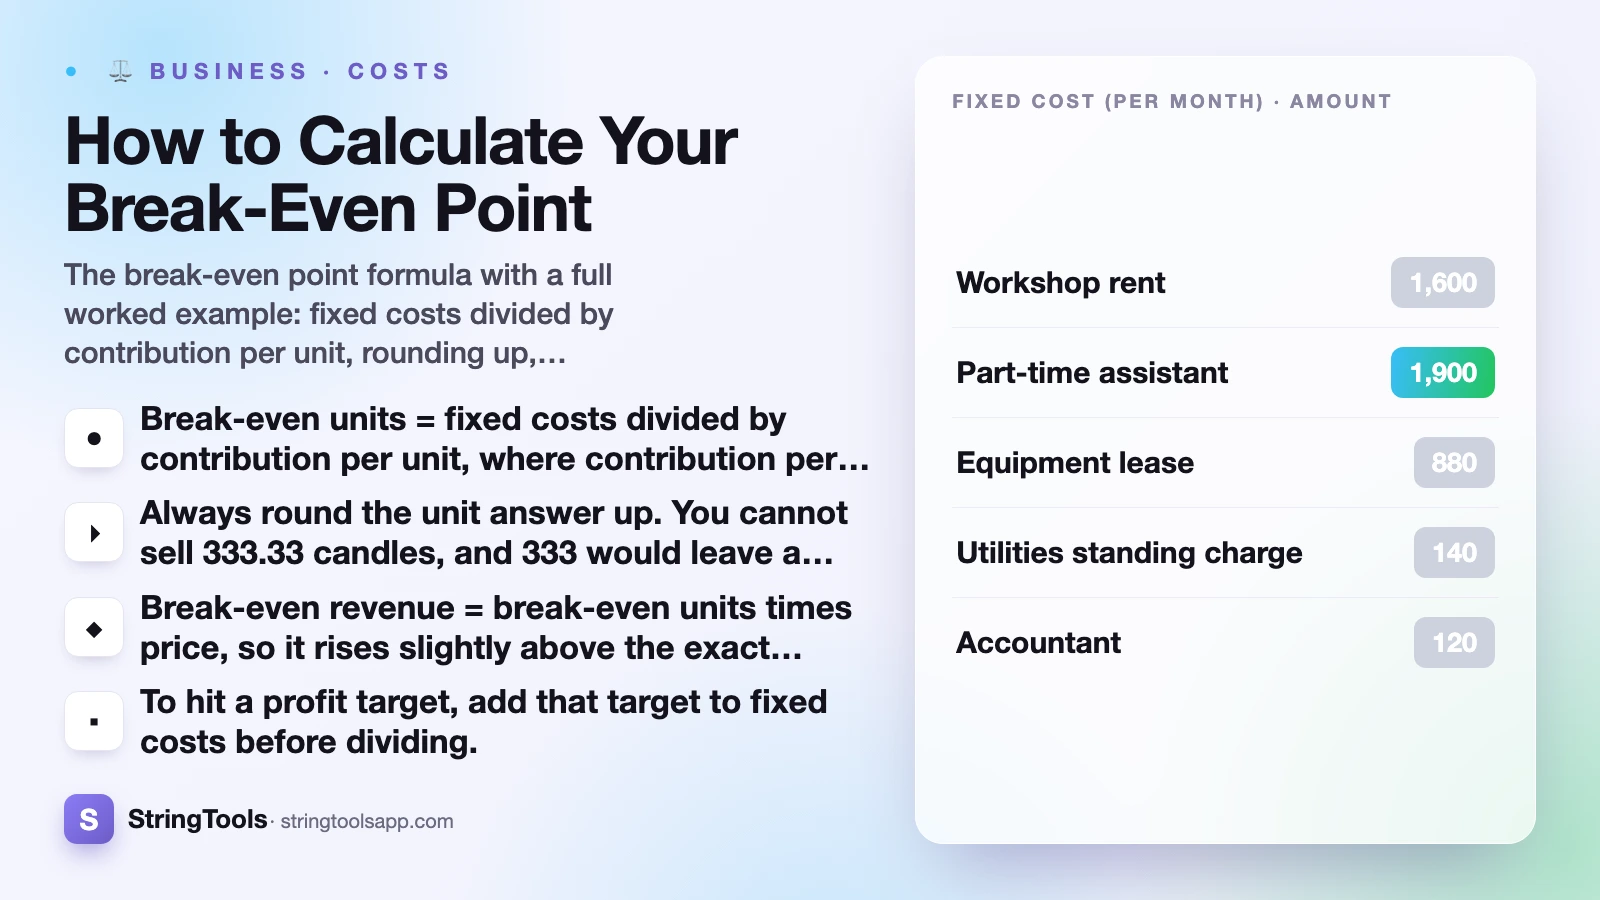
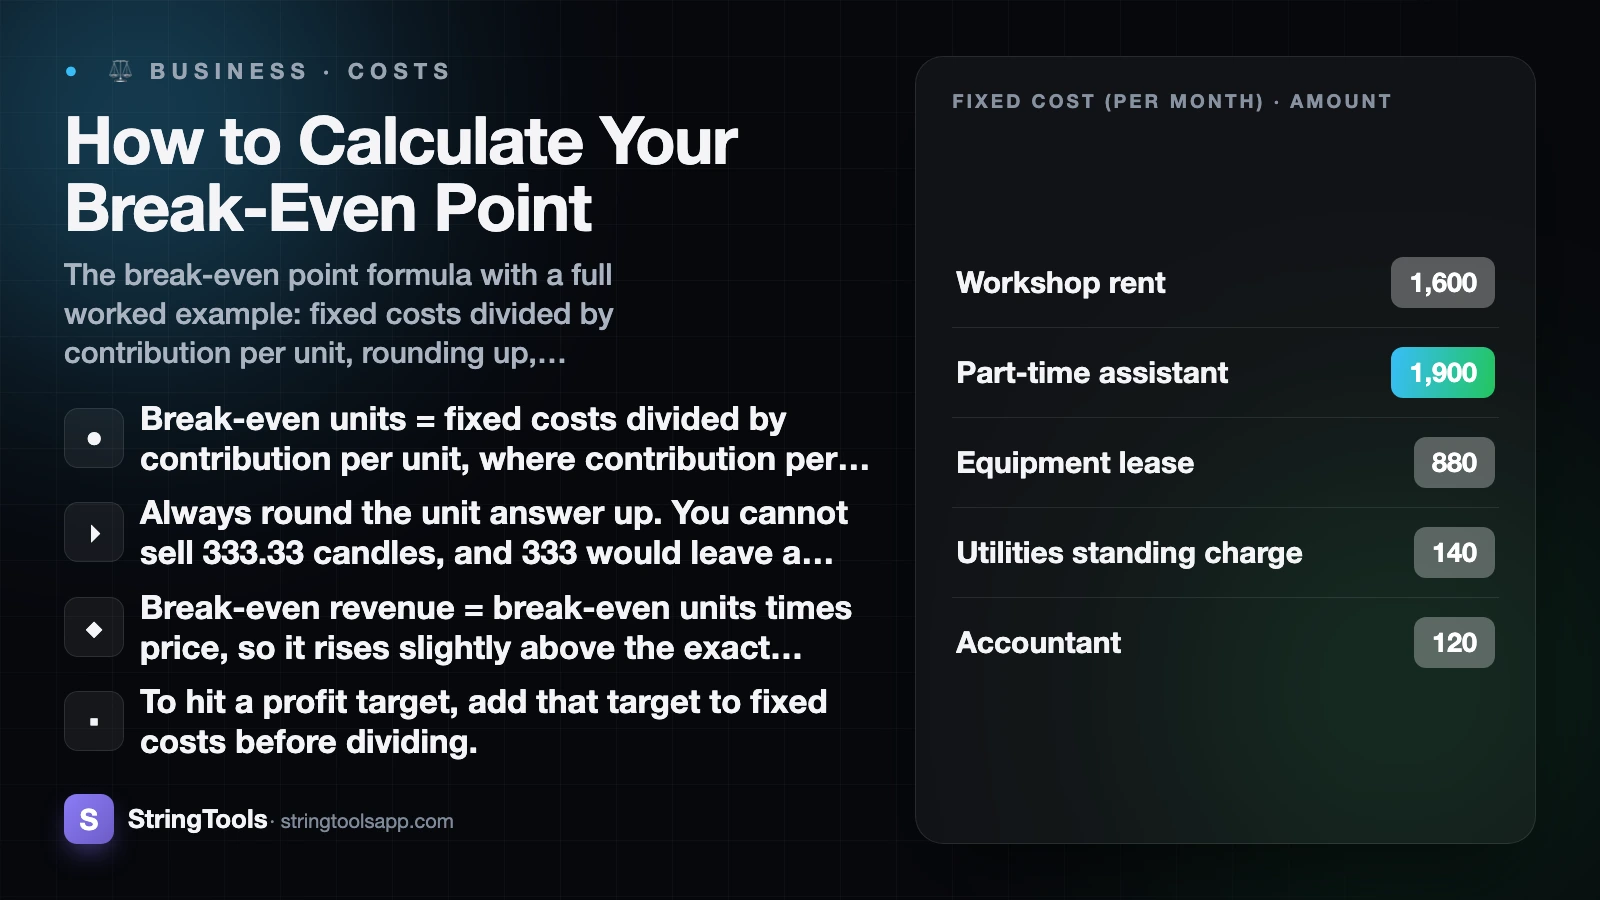
| Fixed cost (per month) | Amount |
|---|---|
| Workshop rent | 1,600 |
| Part-time assistant | 1,900 |
| Equipment lease | 880 |
| Utilities standing charge | 140 |
| Accountant | 120 |
| Insurance | 90 |
| Website and email tools | 70 |
| Total fixed costs | 4,800 |
And here is what one candle costs to make and ship:
| Variable cost (per candle) | Amount |
|---|---|
| Wax and fragrance | 4.20 |
| Jar and lid | 2.10 |
| Packaging and postage | 1.10 |
| Card processing fee | 0.90 |
| Wick and label | 0.70 |
| Total variable cost | 9.00 |
Now the arithmetic, in three steps.
- Contribution per unit: 24.00 minus 9.00 = 15.00. Every candle sold puts 15.00 toward the 4,800.
- Break-even units: 4,800 divided by 15.00 = 320 candles.
- Break-even revenue: 320 times 24.00 = 7,680.
Check it the long way round. At 320 candles, revenue is 7,680. Total cost is 4,800 of fixed costs plus 320 times 9.00 of variable costs, which is 4,800 plus 2,880 = 7,680. Revenue equals cost, profit is zero. That is break-even, and the check is worth doing the first time you run the numbers, because it catches a cost you filed in the wrong bucket.
Candle 321 does not earn 24.00 of profit. It earns 15.00 — the contribution — because the 9.00 of variable cost is still there. That distinction is where most back-of-envelope estimates go wrong.
Why the Unit Answer Rounds Up
Change one thing: the workshop rent rises and fixed costs become 5,000 a month. Contribution stays at 15.00, so break-even is 5,000 divided by 15.00 = 333.33 candles.
You cannot sell a third of a candle, and stopping at 333 leaves 5.00 of fixed cost uncovered, so the honest answer is 334 candles. That is why the formula rounds up rather than to the nearest whole number.
Rounding up has a small side effect that surprises people. At 334 candles, revenue is 334 times 24.00 = 8,016, while total cost is 5,000 plus 334 times 9.00 = 8,006. You are 10.00 in profit at your "break-even" volume, not at zero. That is the rounding, not an error.
A practical warning if you are building this in a spreadsheet: binary floating point does not hold decimal values exactly. Ask a spreadsheet for 90 times 1.1 and it may hold 99.00000000000001 internally, which is enough to push a ceiling function up by a whole unit and hand you a break-even that is one higher than it should be. Round prices and costs to the cent before you divide, and sanity-check the result the long way round as above.
Break-Even for a Profit Target
Break-even is survival, not a plan. Most owners want a number that includes paying themselves properly. The adjustment is one addition:
Units for a target profit = (fixed costs + target profit) divided by contribution per unit.
The candle maker wants 3,000 of profit in the month. That is (4,800 + 3,000) divided by 15.00 = 520 candles, or 12,480 of revenue.
Note what happened: the profit target of 3,000 needed 200 extra candles on top of the 320, because each one contributes 15.00 and 3,000 divided by 15.00 is 200. Every unit above break-even turns its full contribution into profit, which is why the second half of a good month feels so different from the first.
This is also the fastest sanity test of a business idea. Work out the volume the target profit requires, then ask whether you can realistically sell it. If your plan needs 520 candles and your best month ever was 300, the answer is not "try harder" — it is a change to price, cost or cost base. The profit margin calculator is the other half of that conversation: it shows what a price change does to margin and markup before you feed the new price into break-even.
What Actually Moves the Number
Only three levers exist, and they are not equally powerful. Holding fixed costs at 4,800 and variable cost at 9.00, here is what a change in price does to the 320-candle target:
| Price change | Price | Contribution | Break-even units | Change |
|---|---|---|---|---|
| −20% | 19.20 | 10.20 | 471 | +151 |
| −10% | 21.60 | 12.60 | 381 | +61 |
| −5% | 22.80 | 13.80 | 348 | +28 |
| base | 24.00 | 15.00 | 320 | — |
| +5% | 25.20 | 16.20 | 297 | −23 |
| +10% | 26.40 | 17.40 | 276 | −44 |
| +20% | 28.80 | 19.80 | 243 | −77 |
And here is the same exercise on variable cost, with price held at 24.00:
| Variable cost change | Variable cost | Contribution | Break-even units | Change |
|---|---|---|---|---|
| −20% | 7.20 | 16.80 | 286 | −34 |
| −10% | 8.10 | 15.90 | 302 | −18 |
| −5% | 8.55 | 15.45 | 311 | −9 |
| base | 9.00 | 15.00 | 320 | — |
| +5% | 9.45 | 14.55 | 330 | +10 |
| +10% | 9.90 | 14.10 | 341 | +21 |
| +20% | 10.80 | 13.20 | 364 | +44 |
Two things stand out. A 10% price rise removes 44 candles from the target, while a 10% cut in variable cost removes only 18 — price moves contribution by 2.40 while the cost cut moves it by 0.90. And discounting is expensive in both directions: a 10% discount adds 61 candles to the volume you must sell just to stand still.
Fixed costs move the answer in a straight line, because they sit alone on top of the division:
| Monthly fixed costs | Break-even units | Break-even revenue |
|---|---|---|
| 1,500 | 100 | 2,400 |
| 3,000 | 200 | 4,800 |
| 4,500 | 300 | 7,200 |
| 4,800 | 320 | 7,680 |
| 6,000 | 400 | 9,600 |
| 7,500 | 500 | 12,000 |
| 9,000 | 600 | 14,400 |
Every 1,500 of fixed cost adds exactly 100 candles at this contribution. That is the real cost of a new subscription or a bigger unit, expressed in the only currency that matters — the extra sales it commits you to.
When There Is No Break-Even at All
If the contribution per unit is zero or negative, the formula has no answer, and printing one would be a lie. Two cases:
- Contribution is exactly zero. Price 40.00, variable cost 40.00. Each sale covers its own costs and contributes nothing to the fixed 4,800. Selling ten units and selling ten million both end the month 4,800 down.
- Contribution is negative. Price 20.00, variable cost 26.00. You lose 6.00 on every sale. There is no volume that fixes this. Growth makes the loss bigger, which is precisely the trap behind a lot of early "traction" that never turns into a business.
A calculator that returns a negative or absurdly large unit count in these cases is not telling you the truth. The honest output is "there is no break-even here — change the price or the unit economics first".
Watch for the subtler version too, where contribution is positive but tiny. At a contribution of 1.00 on a 24.00 price — a variable cost of 23.00 — break-even is 4,800 candles. Let the variable cost rise 10%, to 25.30, and the break-even point does not move further away, it stops existing: contribution is now −1.30 and every sale loses money. A thin contribution makes the whole model fragile, which is the argument for running the sensitivity table before you commit to a price.
What This Model Deliberately Leaves Out
Treat break-even as a floor and a decision aid, not a forecast. Four things it does not model:
- Product mix. The formula assumes one product. With several, contribution differs per line and the total depends on which ones sell. You can approximate with a weighted average contribution, but the answer only holds while the mix holds.
- Step-fixed costs. Fixed costs are not a flat line forever. Pass a certain volume and you need a second oven, a bigger unit or another pair of hands, and the line steps up. Model the step where you expect it rather than extrapolating.
- Tax. Profit targets in this model are pre-tax. Work out the pre-tax figure your after-tax target requires before you set the volume, and check the treatment for your own country with your tax authority — the IRS small business guidance and GOV.UK self-employed expenses are the starting points in the US and the UK respectively.
- Timing. Break-even is about profit, not cash. You can break even on paper and still run out of money because customers pay in 60 days and suppliers want 30. Cash-flow planning is a separate exercise.
Run the number monthly rather than once. Costs drift, suppliers reprice, and a subscription you forgot about has been quietly adding units to your target since March. The US Small Business Administration guide to calculating startup costs is a good prompt list for the fixed costs people forget, and the Corporate Finance Institute's break-even explainer sets out the same model in accounting terms if you want the textbook version.
Once you have the number, the follow-up question is how much headroom you have above it. That is margin of safety, and it is the difference between a business that is fine and a business that is one slow month from trouble.
This article is general business information, not accounting or tax advice. For decisions that affect your filings, your liabilities or your funding, talk to a qualified accountant in your own country.
Frequently Asked Questions
What is the break-even point formula?
Break-even units = fixed costs divided by contribution per unit, where contribution per unit = selling price minus variable cost per unit. Round the result up to a whole unit. Break-even revenue = break-even units times price. With fixed costs of 4,800, a price of 24.00 and a variable cost of 9.00, contribution is 15.00, break-even is 320 units and break-even revenue is 7,680.
How do I calculate break-even in revenue rather than units?
Two routes get you there, and they agree whenever the unit count divides exactly. Multiply break-even units by the price — 320 times 24.00 = 7,680. Or divide fixed costs by the contribution margin ratio: contribution of 15.00 on a 24.00 price is a ratio of 0.625, and 4,800 divided by 0.625 = 7,680. When the units have to be rounded up the two part company slightly: at fixed costs of 5,000 the ratio route gives 8,000, while 334 rounded-up units at 24.00 gives 8,016. The ratio route is the more useful one when you sell many products at different prices, because you can use a blended ratio.
Why does the break-even unit count round up instead of down?
Because a part-unit is not a sale you can make, and rounding down leaves fixed costs uncovered. If fixed costs are 5,000 and contribution is 15.00, exact break-even is 333.33 units. Selling 333 leaves 5.00 of fixed cost unpaid, so the answer is 334. At 334 units revenue is 8,016 against total costs of 8,006, a 10.00 profit created purely by the rounding.
Should I include my own salary in fixed costs?
If you pay yourself a regular amount that does not vary with sales, yes — put it in fixed costs and the break-even figure then represents a month where you are actually paid. If you take whatever is left over, leave it out of fixed costs and use the target-profit version instead: your pay becomes the target. Mixing the two, by both paying yourself a salary and treating profit as your income, double counts.
How many units do I need to sell for a specific profit?
Add the profit to fixed costs before dividing: (fixed costs + target profit) divided by contribution per unit. For the candle maker, a 3,000 profit target means (4,800 + 3,000) divided by 15.00 = 520 units and 12,480 of revenue — 200 units more than the 320 needed to break even, because each unit above break-even contributes its full 15.00 to profit.
What if my variable cost is higher than my price?
Then there is no break-even point. With a price of 20.00 and a variable cost of 26.00 you lose 6.00 on every sale, and selling more makes the loss larger, not smaller. The same is true when they are equal: contribution is zero, so no volume ever covers the fixed costs. Fix the unit economics — raise the price, cut the unit cost or drop the product — before setting any sales target.
Sources and references
IRS small business guidance (irs.gov) · GOV.UK self-employed expenses (gov.uk) · US Small Business Administration guide to calculating startup costs (sba.gov) · Corporate Finance Institute's break-even explainer (corporatefinanceinstitute.com). Content was reviewed against these sources as of the last-updated date above; external figures and rules may change after publication.