
Margin of Safety, Defined
Your margin of safety is the gap between the sales you expect and the sales you need. Subtract break-even volume from expected volume, then divide by expected volume: a business expecting 420 units against a break-even of 320 has a margin of safety of 100 units, or 23.8%. Sales can fall by that much before the month turns into a loss.
Key Takeaways
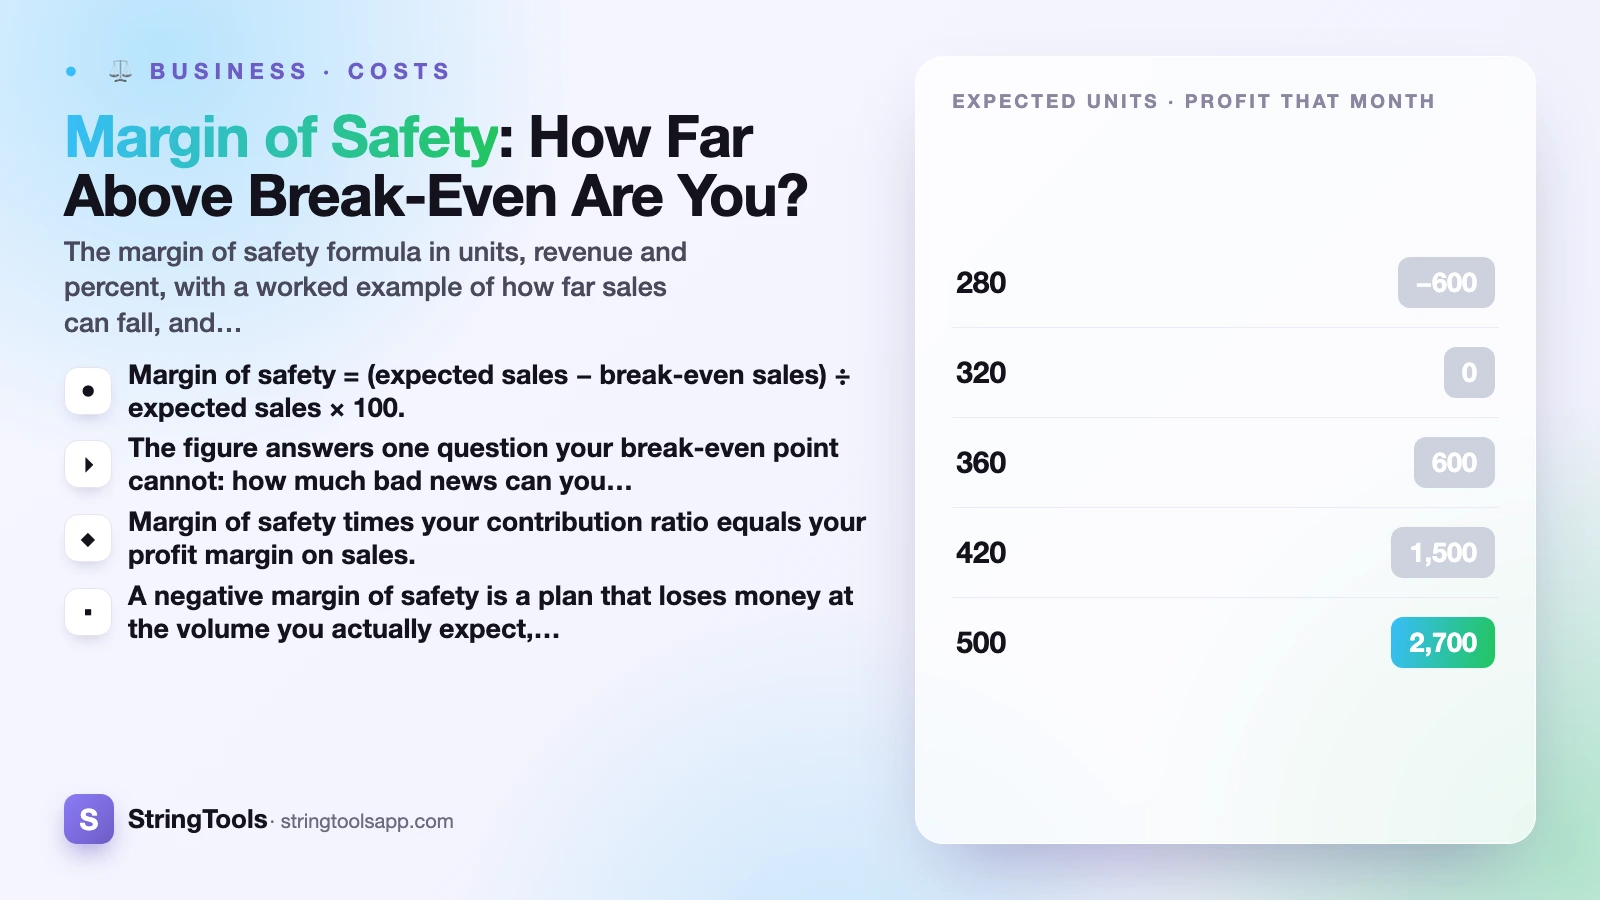
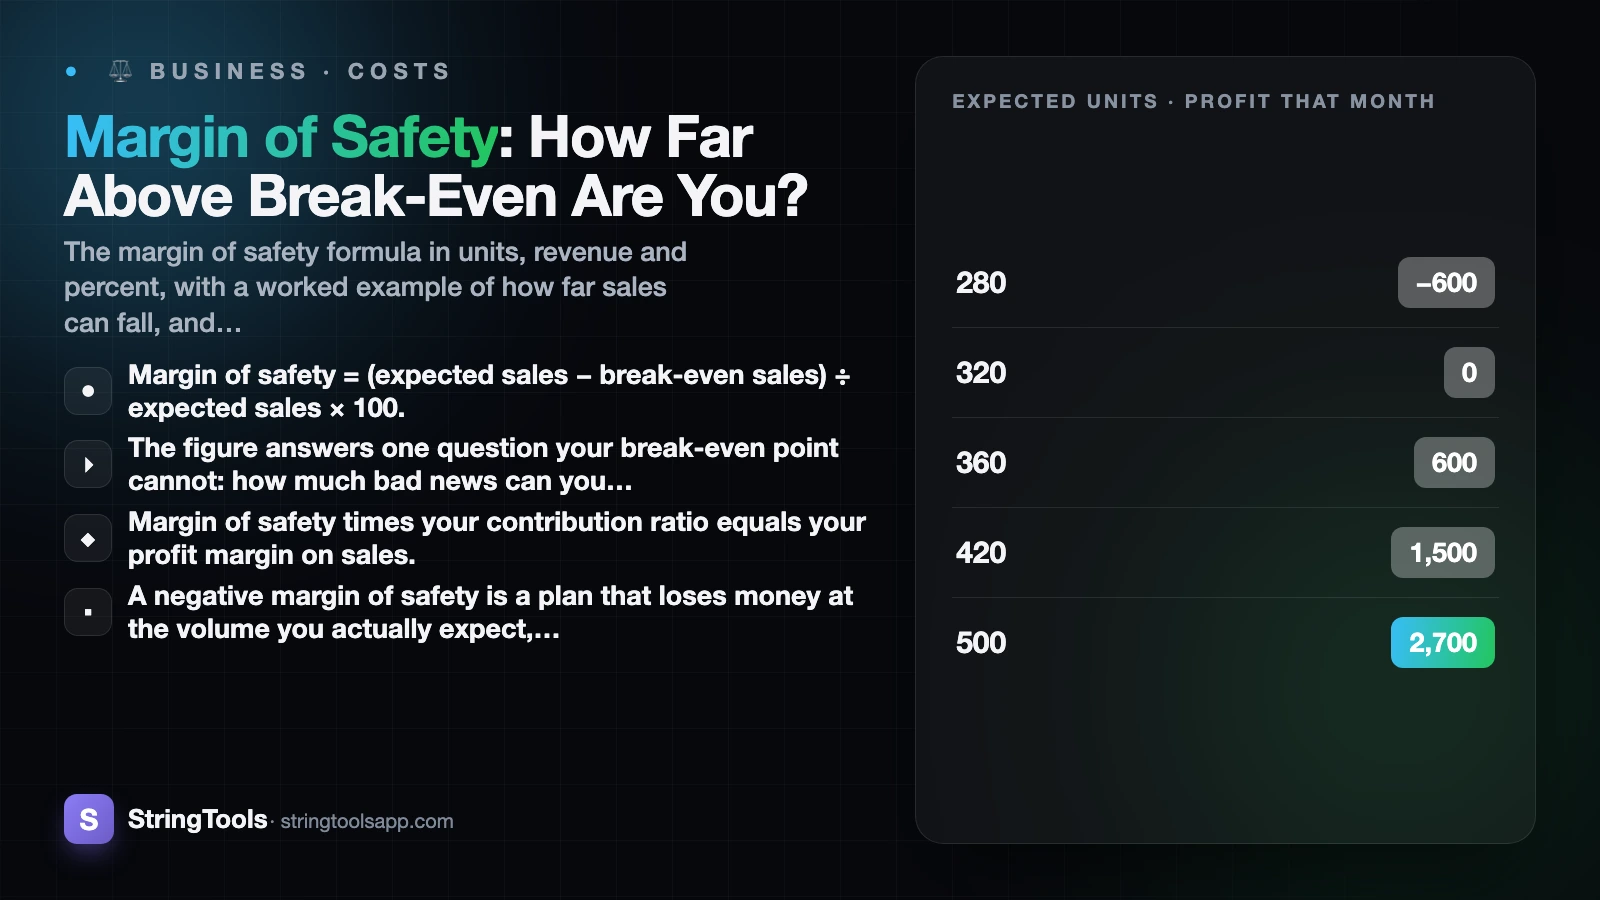
- Margin of safety = (expected sales − break-even sales) ÷ expected sales × 100. It works identically in units or in revenue.
- The figure answers one question your break-even point cannot: how much bad news can you absorb.
- Margin of safety times your contribution ratio equals your profit margin on sales. They are the same fact seen from two angles.
- A negative margin of safety is a plan that loses money at the volume you actually expect, and needs a change to price, cost or volume rather than optimism.
- An annual margin of safety can look comfortable while individual quarters sit below break-even, which is where the cash problems live.
This is the number that turns break-even from a milestone into a risk measure. The break-even calculator reports the margin of safety in units, in revenue and as a percentage once you enter the volume you expect, alongside the profit at that volume.
The Formula, in Three Forms
All three forms describe the same gap.
In units
Expected units minus break-even units. With a break-even of 320 units and an expectation of 420, the margin of safety is 100 units.
In revenue
Expected revenue minus break-even revenue, or simply the unit gap times the price. At 24.00 a unit, 100 units is 2,400 of revenue. Revenue could drop from 10,080 to 7,680 before the business stops covering its costs.
As a percentage
The unit or revenue gap divided by the expected figure: 100 divided by 420 = 23.8%. The percentage is the form worth quoting, because it is comparable across periods and across businesses of different sizes.
One subtlety that trips people up. Because break-even units round up to a whole unit, the percentage calculated from units and the percentage calculated from revenue can differ in the second decimal place. It does not matter. Margin of safety is a risk indicator, not a filing, and the difference between 23.8% and 23.9% changes no decision you will ever make.
If the expected figure is below break-even, the formula returns a negative number, and that negative is meaningful: it is the shortfall you have to close. It is not an error to be hidden.
A Worked Example You Can Follow Through
Take the same small maker used throughout this cluster: 4,800 of monthly fixed costs, a price of 24.00 and a variable cost of 9.00, so contribution is 15.00 and break-even is 4,800 divided by 15.00 = 320 units. Here is what different expectations look like:
| Expected units | Margin of safety (units) | As a percentage | In revenue | Profit that month |
|---|---|---|---|---|
| 280 | −40 | −14.3% | −960 | −600 |
| 320 | 0 | 0.0% | 0 | 0 |
| 360 | 40 | 11.1% | 960 | 600 |
| 420 | 100 | 23.8% | 2,400 | 1,500 |
| 500 | 180 | 36.0% | 4,320 | 2,700 |
| 640 | 320 | 50.0% | 7,680 | 4,800 |
Read the 420 row carefully, because the whole idea is in it. The margin of safety is 100 units, and the profit is 1,500 — which is exactly 100 times the 15.00 contribution. Past break-even, every unit of margin of safety is a unit of contribution that turns straight into profit. The margin of safety and the profit are the same thing counted differently.
At 640 units the margin of safety is 50%, meaning sales could halve and the business would still cover its costs. At 280 units it is negative: 40 units short, 600 of loss. No amount of describing that as "nearly break-even" changes the arithmetic.
If you have not worked out your own break-even volume yet, how to calculate your break-even point walks through it with the same figures.
Reading the Percentage Honestly
There is no universal threshold for a healthy margin of safety, and any article quoting one is inventing it. What the number should be depends on how volatile your sales are and how quickly you could cut costs if they fell.
A more useful way to read it is to convert the percentage into a sentence about your own worst month:
- Around 10%. One quiet month, one lost customer or one supplier price rise puts you into a loss. Treat the figure as a warning rather than a result.
- Around 25%. You can absorb a normal bad month. Something structural — losing a major client, a seasonal collapse — still hurts.
- Around 50%. Sales could halve and you would still cover costs. Businesses with lumpy or concentrated revenue usually find they need a cushion towards this end, but that is a conclusion their own worst month has to support, not a target to adopt from a list.
Then do the honest test. Look at your worst month in the last two years and express the drop as a percentage of a normal month. If that drop is larger than your margin of safety, you have already lived through a month this plan does not survive.
Two structural factors move the requirement. Heavy fixed costs raise the margin of safety you need, because there is little to cut when revenue falls. Customer concentration does the same: if one client is 30% of revenue, a 23.8% margin of safety does not cover losing them. Fixed vs variable costs covers the trade-off between a fixed-heavy and a variable-heavy cost base, and the choice largely determines how much cushion you need.
The Identity Worth Knowing
Margin of safety percentage times contribution margin ratio equals profit margin on sales.
Check it with the numbers above. The margin of safety at 420 units is 23.81%, and the contribution ratio is 15.00 divided by 24.00 = 62.5%. Multiply them: 23.81% times 0.625 = 14.88%. And the actual profit margin is 1,500 of profit on 10,080 of revenue = 14.88%. The same fact, twice.
That identity is useful because it names the only two levers on profitability: sell further above break-even, or keep more of each sale. If your profit margin is thin, one of those two is the reason, and this tells you which.
It also lets you translate the cushion into specific shocks. At 420 units the buffer is 1,500 of profit, so:
| What goes wrong | How much it would take to reach break-even |
|---|---|
| Fixed costs rise | +1,500 a month, from 4,800 to 6,300 |
| Variable cost per unit rises | +3.57 a unit, from 9.00 to 12.57 |
| Price falls | −3.57 a unit, from 24.00 to 20.43 |
| Volume falls | −100 units, from 420 to 320 |
Those four rows are the same 1,500 of cushion expressed in the four ways a business actually gets hurt. A 3.57 rise in unit cost sounds small until you see it is your entire profit, which is the argument for checking the sensitivity table before you accept a supplier increase. The profit margin calculator is the quicker route when the question is what a price change does to margin and markup.
Why the Annual Figure Lies
A single yearly margin of safety hides seasonality, and seasonality is what actually breaks businesses. Take the same maker over a year with a strong fourth quarter: fixed costs of 14,400 a quarter (57,600 for the year), 5,040 units sold, contribution of 15.00.
For the year: break-even is 57,600 divided by 15.00 = 3,840 units, so the margin of safety is 1,200 units, or 23.8%, and profit is 18,000. Comfortable. Now split it by quarter, where break-even is 960 units each:
| Quarter | Units sold | Margin of safety | Profit or loss |
|---|---|---|---|
| Q1 | 780 | −23.1% | −2,700 |
| Q2 | 1,020 | 5.9% | 900 |
| Q3 | 1,140 | 15.8% | 2,700 |
| Q4 | 2,100 | 54.3% | 17,100 |
| Year | 5,040 | 23.8% | 18,000 |
Three of the four quarters are at or below a 16% margin of safety and the first one loses 2,700. The annual figure is arithmetically correct and practically useless as a risk measure, because the business has to survive Q1 with cash it earned in the previous Q4.
Calculate the margin of safety at the frequency your cash actually moves — monthly for most small businesses, quarterly at the widest. Then hold the weakest period, not the average, as the number that describes your risk.
Widening the Gap
Only four things move a margin of safety, and they are not equally available in a hurry.
- Raise the price. The fastest lever, because it moves contribution one for one. A 10% rise on a 24.00 price takes contribution from 15.00 to 17.40 and drops break-even from 320 to 276 units, widening the cushion at any volume.
- Cut the variable cost. Slower, and usually smaller: a 10% cut in a 9.00 cost is worth only 0.90 of contribution against the 2.40 from the price rise. Worth doing, rarely enough on its own.
- Cut fixed costs. Every 1,500 removed cuts break-even by 100 units at this contribution. Subscriptions, unused space and the tier of software you no longer need are where this hides.
- Sell more. The obvious lever and the least reliable one, which is why it should not be the whole plan.
There is a fifth, quieter option: convert fixed costs into variable ones. Outsourcing costs more per unit but lowers the volume at which you start losing money, which is a sensible trade when revenue is unpredictable.
One clarification, because the phrase is overloaded. Margin of safety in value investing means something different — the discount between a share price and an estimated intrinsic value. This article is about the operating version: the buffer between expected sales and break-even sales. For the accounting treatment, the Corporate Finance Institute's margin of safety reference sets it out formally, and the US Small Business Administration's guidance on managing business finances covers where it fits in a wider financial routine.
Finally, remember what this model excludes. It assumes one product with a stable mix, fixed costs that do not step up with growth, and figures before tax. Contribution margin explains how to handle a mix with a weighted ratio.
This article is general business information, not accounting or tax advice. For decisions that affect your filings, your borrowing or your funding, talk to a qualified accountant in your own country.
Frequently Asked Questions
What is the margin of safety formula?
Margin of safety = (expected sales − break-even sales) ÷ expected sales × 100. It works in units or in revenue and gives the same percentage either way. With a break-even of 320 units and expected sales of 420, the margin of safety is 100 units, 2,400 of revenue at a 24.00 price, or 23.8%. That is how far sales can fall before the period turns into a loss.
What is a good margin of safety percentage?
There is no universal figure, and any quoted benchmark is invented. It depends on how volatile your sales are and how fast you could cut costs. A practical test: take your worst month in the last two years, express the drop from a normal month as a percentage, and compare it with your margin of safety. If the historic drop is bigger, your plan does not survive a month you have already lived through.
What does a negative margin of safety mean?
It means the volume you expect is below the volume you need, so the plan loses money as written. Expecting 280 units against a break-even of 320 gives a margin of safety of −40 units, or −14.3%, and a loss of 600 at a 15.00 contribution. The answer is a change to price, cost base or volume rather than a more optimistic forecast.
How does margin of safety relate to profit?
Directly. Margin of safety in units times contribution per unit equals profit: 100 units times 15.00 = 1,500. And margin of safety percentage times contribution margin ratio equals profit margin on sales: 23.81% times 62.5% = 14.88%, which matches 1,500 of profit on 10,080 of revenue. They are two views of the same arithmetic.
Should I calculate margin of safety monthly or annually?
At the frequency your cash actually moves, which for most small businesses is monthly. An annual figure averages away seasonality: a maker with a 23.8% margin of safety for the year can still have a first quarter at −23.1% that loses 2,700. Hold the weakest period as your true risk measure, not the average.
Is this the same margin of safety used in investing?
No. In value investing the term describes the discount between a share's price and an estimate of its intrinsic value. In management accounting it is the operating buffer between expected sales and break-even sales. Same phrase, unrelated calculation, and only the operating version is discussed here.
Sources and references
Corporate Finance Institute's margin of safety reference (corporatefinanceinstitute.com) · US Small Business Administration's guidance on managing business finances (sba.gov). Content was reviewed against these sources as of the last-updated date above; external figures and rules may change after publication.