
Purchasing power: the short answer
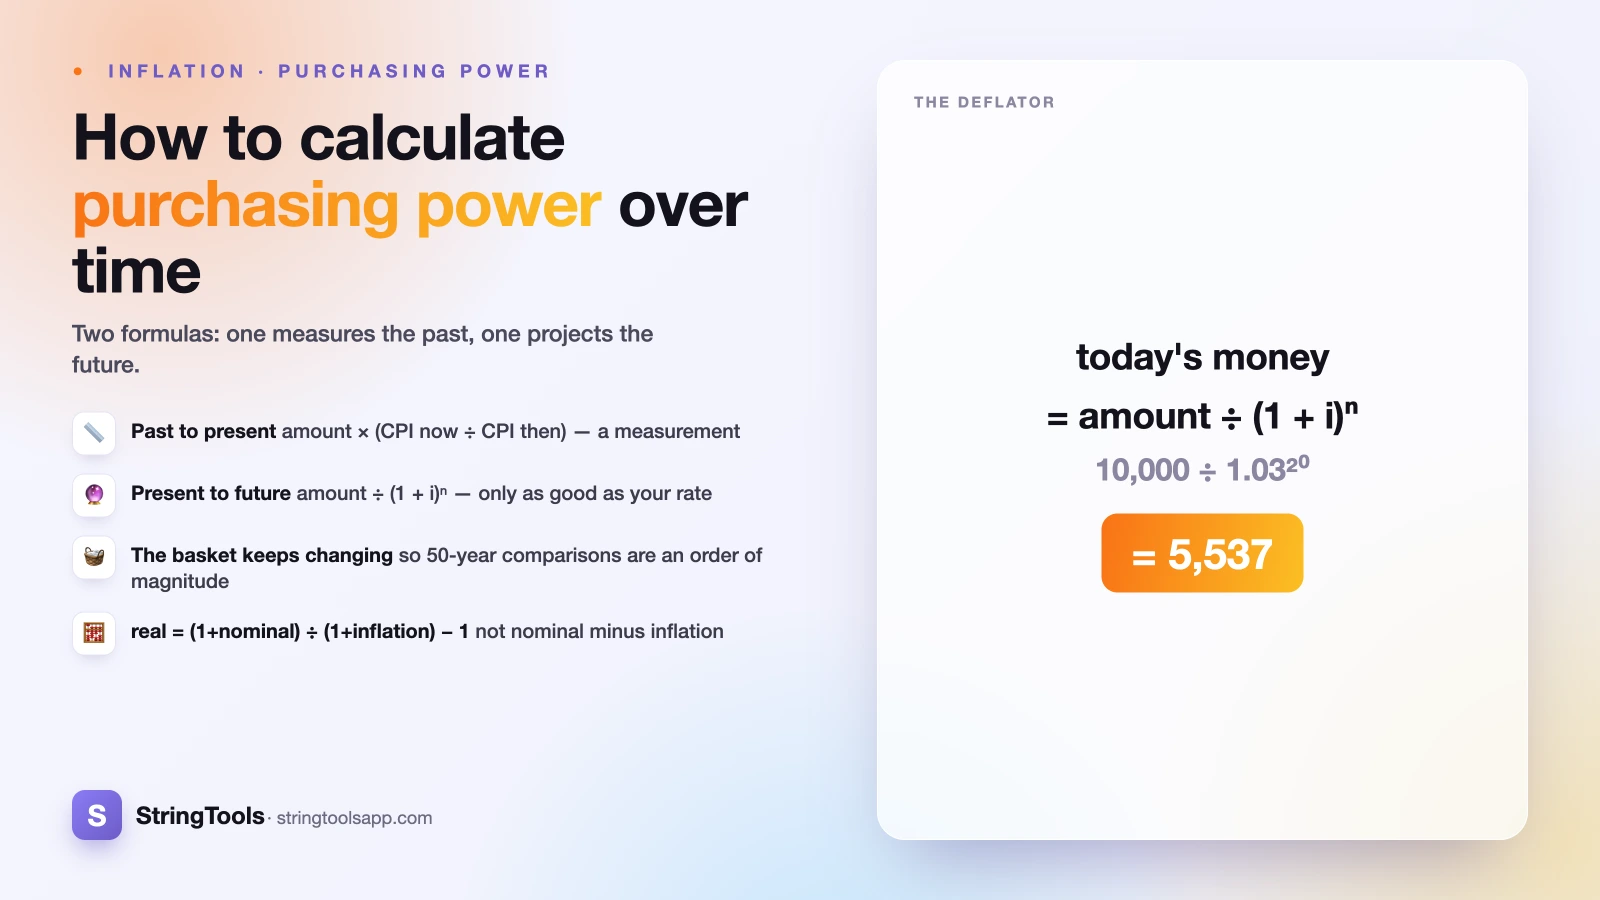
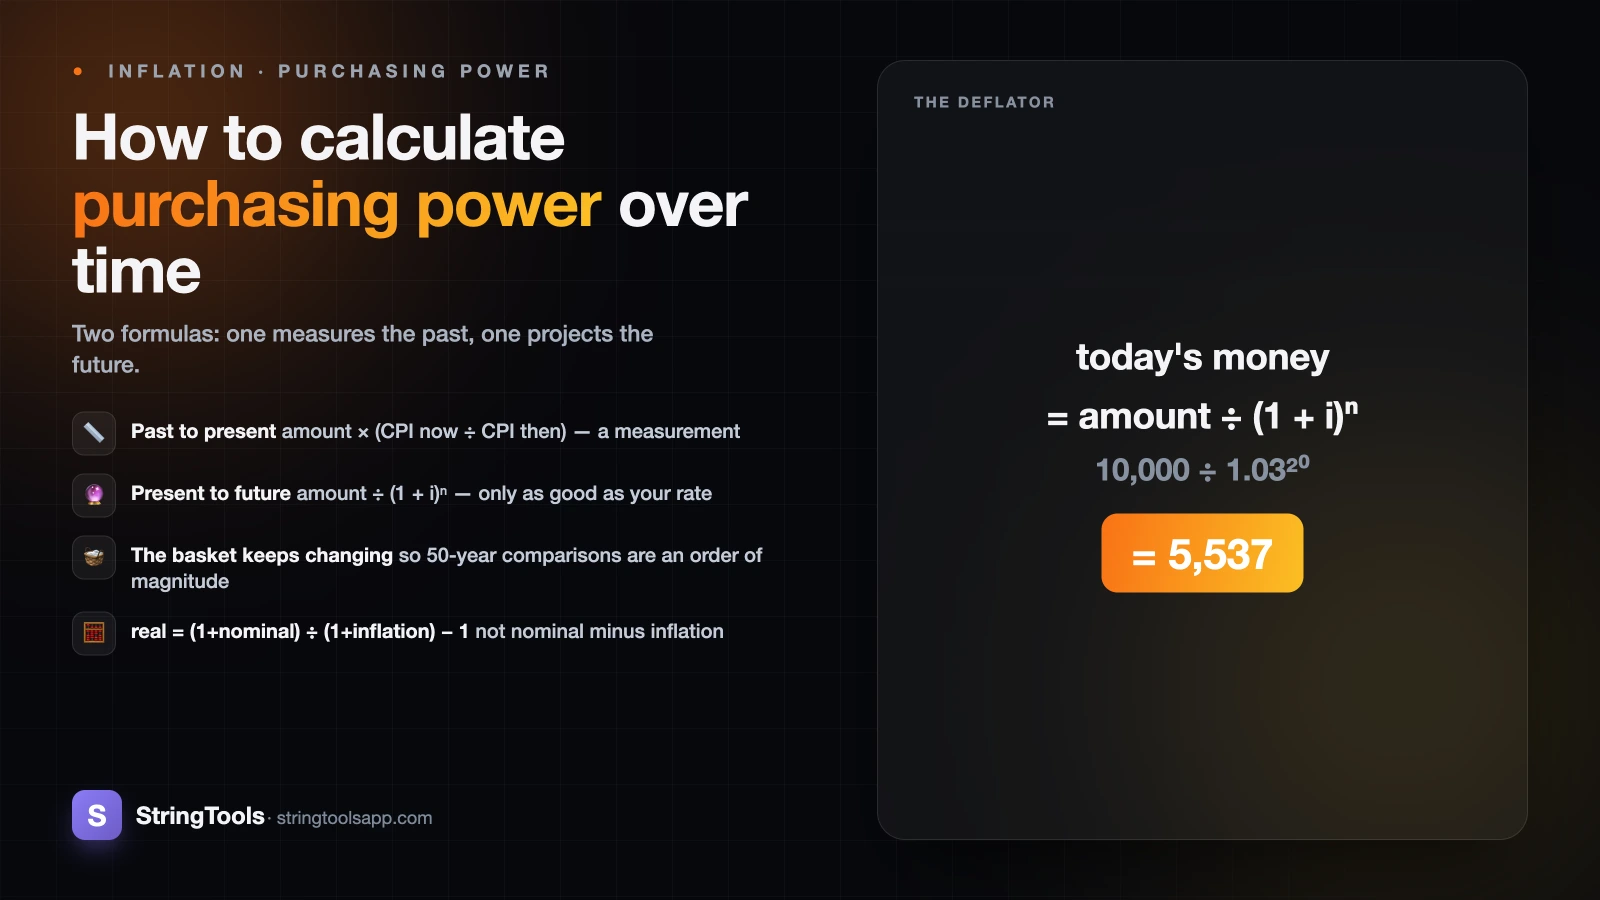
Purchasing power is what a sum of money buys. Two calculations cover it. To put a past amount in today's money, multiply it by today's price index divided by the index back then. To find what today's money buys in future, divide it by one plus inflation, raised to the number of years.
Key Takeaways
- Past to present uses a real measured price index:
amount x (CPI_now / CPI_then). - Present to future uses an assumed rate, because nobody has next decade's index:
amount / (1 + i)^n. - The first is a measurement. The second is a projection, and only as good as the rate you feed it.
- A price index tracks the cost of a fixed, weighted basket of goods and services, re-based so one period equals 100.
- The basket is revised regularly, which is right for measuring today and awkward for comparing across half a century.
- Real return is
(1 + nominal) / (1 + inflation) - 1, not nominal minus inflation, though the two are close at low rates.
Most people meet this in one of two shapes: an old figure they want to size up in modern terms, or a number today they want to hold onto for years. The arithmetic is short either way. The care goes into which index you use, and knowing where the method stops being trustworthy.
What a price index actually is
A price index is not a price. It is a number with no units that tracks how the cost of a defined shopping list has moved relative to a reference period. Three ideas build it.
The basket. Statisticians pick a representative set of goods and services that households actually buy: groceries, rent, fuel, transport, clothing, broadband, haircuts, insurance. Price collectors then record what those specific items cost, in the same outlets, month after month.
The weights. A basket where bread and cars counted equally would be nonsense. Each category is weighted by how much of total household spending it accounts for, drawn from national expenditure surveys. Housing and transport carry heavy weights in most countries; a category you spend nothing on barely moves your personal experience of inflation even when its weight is large.
The re-basing. The weighted average is then expressed relative to a base period, which is set to 100. If the index reads 130 against a base of 100, the basket costs 30 per cent more than it did in the base period. The base is periodically reset, so a long series may be spliced together from several bases.
The headline consumer price index is the general-purpose measure, but most countries publish several variants, differing in whether they include owner-occupied housing costs, mortgage interest, or volatile food and energy. The US Bureau of Labor Statistics and the UK Office for National Statistics both publish full index tables and the methodology behind them. If you want the construction in more depth, our sibling piece on what CPI is and how it is measured goes through it step by step.
Direction one: turning a past amount into today's money
This is the measured direction, and it is the one to prefer whenever the period you care about is already in the past. The formula is a simple ratio:
value in today's money = past amount x (CPI_now / CPI_then)
You need two index readings from the same published series: one for the month or year of the past amount, one for the most recent period available.
A worked example
The index numbers below are illustrative so the arithmetic is easy to follow. They are not real published values for any country or year. Get real ones from your own national statistics office before you quote a figure.
Say a salary of 1,000 was paid in Year A, when the index stood at 42.3. Today the same series reads 130.7.
- The ratio is 130.7 / 42.3 = 3.09.
- 1,000 x 3.09 = 3,090 in today's money.
So that salary had roughly three times the buying power the raw number suggests. Run it the other way and the logic holds: 1,000 today would have been worth 1,000 x (42.3 / 130.7) = about 324 in Year A prices.
One useful by-product: the ratio also gives you the average annual inflation across the gap. If those two readings are 40 years apart, the implied average is 3.09 to the power of 1/40, minus 1, which is about 2.86 per cent a year. That average hides everything that happened in between, but it summarises the stretch fairly.
The arithmetic is identical in any currency. What must not change halfway through is the index series.
Direction two: what today's money will buy later
Going forward, there is no index to look up, because the future has not been measured yet. So you swap the measurement for an assumption and discount:
future value in today's money = amount / (1 + i)^n
where i is the assumed annual inflation rate as a decimal and n is the number of years. This is compounding run backwards. Prices compound upward at (1 + i)^n, so the real worth of a fixed sum shrinks by exactly that factor.
A worked example
Assume 3 per cent a year, purely to keep the example simple. It is not a forecast and not a recommendation.
- 10,000 left in a drawer for 20 years.
- The divisor is 1.03 to the power of 20, which is 1.806.
- 10,000 / 1.806 = 5,537 in today's money.
The cash is still 10,000 in nominal terms. It buys what 5,537 buys now. That is a 44.6 per cent loss of purchasing power, achieved without anything dramatic happening.
There is a mirror version that answers a different question. If you want to know what nominal amount you would need in 20 years to match 10,000 of today's buying power, multiply instead of dividing: 10,000 x 1.806 = 18,061. Long-horizon savings targets need this second version, or they are set in money that will not exist.
The honest caveat: nobody knows next decade's inflation, so everything downstream of your assumed rate is an assumption. Run two or three rates and treat the spread as the answer.
A worked table: 10,000 across the decades
This table applies amount / (1 + i)^n to a fixed 10,000 at an illustrative 3 per cent a year. That rate is chosen because the arithmetic is clean, not because it is a prediction of anything. Substitute your own rate before drawing conclusions.
| Years ahead | Divisor (1.03)^n | 10,000 in today's money | Purchasing power lost | Needed then to match 10,000 today |
|---|---|---|---|---|
| 10 | 1.344 | 7,441 | 25.6% | 13,439 |
| 20 | 1.806 | 5,537 | 44.6% | 18,061 |
| 30 | 2.427 | 4,120 | 58.8% | 24,273 |
| 40 | 3.262 | 3,066 | 69.3% | 32,620 |
| 50 | 4.384 | 2,281 | 77.2% | 43,839 |
Two things are worth noticing. First, the loss is not linear: the first decade costs a quarter of the value, and each later decade works on a smaller base. Second, at 3 per cent, purchasing power roughly halves in a little over 23 years. The quick mental version is to divide 70 by the inflation rate: 70 / 3 is about 23, which is close to the exact 23.4 years.
Because the assumed rate does so much work, here is the same 10,000 at three different illustrative rates:
| Assumed rate | After 10 years | After 20 years | After 30 years |
|---|---|---|---|
| 2% | 8,203 | 6,730 | 5,521 |
| 3% | 7,441 | 5,537 | 4,120 |
| 5% | 6,139 | 3,769 | 2,314 |
The gap between the 2 per cent row and the 5 per cent row after 30 years is more than double. That spread is the point of the table. You can run any of these on your own figures with the inflation calculator, which does both directions of the sum.
Why the basket changes, and what that means for long comparisons
A basket fixed in 1990 would today be pricing fax machines and video rentals while ignoring broadband and streaming. So statistical agencies revise the basket, usually every year, adding what people have started buying and dropping what they have stopped buying. They also adjust the weights as spending patterns shift.
Three adjustments matter for anyone doing long comparisons.
Substitution. When beef gets expensive, people buy more chicken. A basket held rigid overstates the cost of maintaining a living standard, because it insists on the beef. Chained index formulas allow for some substitution; a fixed-basket index does not, and countries differ in which they use.
Quality change. A car today is not the car of thirty years ago, and neither is a phone. If the price doubles while the product improves substantially, some of that rise is buying more product, not paying more for the same product. Agencies apply quality adjustment, sometimes using hedonic methods that price the individual features. It is defensible, it is necessary, and it is genuinely contested at the edges.
New goods. Products enter the index once established, so the early part of a price history, often its steepest fall, is missed.
The practical consequence: a CPI ratio across five, ten, twenty years is solid. Across fifty or a hundred it becomes an approximation with a wide error band, because you are chaining together baskets that share almost nothing. Someone in 1930 could not buy antibiotics or air travel at any price, so no index can tell you honestly what their money was worth in modern terms. Treat very long conversions as an order of magnitude, not a figure, and say so when you quote one.
There is a personal version of the problem too. The index reflects an average household, so if rent takes a much bigger share of your spending than the national weight, your lived inflation rate differs from the headline. Investopedia's definition of the consumer price index sets out the standard construction if you want the textbook version.
Applying it to savings and investments
Purchasing power is the only sensible way to judge whether savings are actually growing. A balance that rises in nominal terms can still be shrinking in real terms, and interest paid on cash is often the clearest example.
The correct adjustment is not subtraction. Use:
real return = (1 + nominal) / (1 + inflation) - 1
With an illustrative 5 per cent nominal return and 3 per cent inflation, that is 1.05 / 1.03 - 1 = 1.94 per cent, not the 2 per cent that subtraction suggests. At low single-digit rates the shortcut is close enough for a rough sanity check; it drifts once either figure gets large.
Applied over time, a real return of 1.94 per cent means the balance grows in purchasing power, but slowly. A nominal return below inflation means it is falling, however healthy the statement looks. Our companion piece on what inflation does to your savings works through that case in detail, and compound interest explained covers the growth side of the same arithmetic.
Two things to hold onto. Investment returns are not guaranteed, and past performance does not predict future results, so any projection using an assumed return is an illustration rather than an expectation. And tax usually applies to the nominal gain, not the real one, which means the after-tax real return is lower again. The rules for that differ by country; your national tax authority is the source, not a blog.
Running this properly on your own numbers
A short checklist that avoids most errors with these two formulas.
- Pick one index series and stay in it. Do not mix a headline CPI reading with a variant that treats housing differently, and check both readings share a base period.
- Match the frequency to the question. Annual averages are right for annual figures. Comparing a single month to an annual average introduces a seasonal wobble you did not intend.
- Use the measured method for the past. Reach for an assumed rate only where no index exists yet, which means the future.
- Run forward projections at more than one rate. A single rate produces a false-precision answer. Two or three produce a range, which is the truthful shape of the result.
- Round honestly. An inflation-adjusted figure quoted to the penny across forty years implies accuracy the index does not have.
- Ask whose basket it is. If your spending is concentrated in one heavily weighted category, the national average is not your rate.
- State the assumption in the output. Any figure you pass on should carry the rate, the years, and the index used, or the reader cannot check it.
One framing is worth more than any single number: purchasing power turns a savings target from a fixed sum into a moving one. A target set in today's money needs the multiplying version of the formula before you can aim at it, and it needs revisiting as real index data replaces your assumption.
This article is general information, not financial advice. For a decision that turns on your own circumstances, a regulated financial adviser is the right person to ask.
Frequently Asked Questions
What is the formula for purchasing power?
There are two, depending on direction. To convert a past amount into today's money, use amount x (CPI_now / CPI_then) with two readings from the same published index series. To find what a sum today will be worth in future, use amount / (1 + i)^n, where i is the assumed annual inflation rate as a decimal and n is the number of years.
Why not just subtract inflation from my interest rate?
Subtraction is an approximation. The exact real return is (1 + nominal) / (1 + inflation) - 1. At an illustrative 5 per cent nominal and 3 per cent inflation, that gives 1.94 per cent rather than the 2 per cent subtraction suggests. The gap is small at low single-digit rates and grows as either figure gets larger, so subtraction is fine for a rough check and wrong for anything you publish.
Where do I get real CPI index numbers?
From your national statistics office, which publishes the full index tables free. In the United States that is the Bureau of Labor Statistics; in the United Kingdom it is the Office for National Statistics. Most countries have an equivalent. Take both readings from the same series and check they share a base period, because published series are re-based periodically and mixing bases produces a nonsense ratio.
How far back can I reliably convert a price?
Conversions across five to twenty years are solid. Across fifty years or more they become an order-of-magnitude estimate, because the basket has been revised so many times that the two ends share almost no goods. Whole categories that did not exist at the earlier date cannot be priced at all, so no index can honestly say what an old sum was worth in modern terms. Quote long conversions as approximate and say why.
Does inflation affect everyone at the same rate?
No. The published index weights each category by average national household spending. If a heavily weighted category such as rent or fuel takes a much larger or smaller share of your budget than average, your lived rate of inflation differs from the headline figure, sometimes substantially. The headline number is the right input for general calculations and a poor description of any particular household.
How long does it take for money to lose half its purchasing power?
Divide roughly 70 by the annual inflation rate for a quick estimate. At an illustrative 3 per cent a year, 70 divided by 3 is about 23 years, and the exact figure from the formula is 23.4 years. At 2 per cent it is about 35 years; at 5 per cent it is about 14. The rule is an approximation that works well for low single-digit rates.
Sources and references
The US Bureau of Labor Statistics (bls.gov) · the UK Office for National Statistics (ons.gov.uk) · Investopedia's definition of the consumer price index (investopedia.com). Content was reviewed against these sources as of the last-updated date above; external figures and rules may change after publication.