
Inflation quietly shrinks money you are holding
Inflation reduces what each unit of your money buys, so savings in an account paying less than the inflation rate lose real value every year even though the balance keeps rising. The number grows; the shopping it covers shrinks. That gap is the whole problem.
Key Takeaways
- A balance can rise and still buy less. Nominal growth and real growth are different measurements.
- What matters is the gap between the rate your money earns and the rate prices rise, not either alone.
- Rule of 72: divide 72 by the erosion rate for the years until purchasing power roughly halves.
- Cash is safe from falling in nominal terms, not from losing purchasing power, and long holding periods make that worse.
- The headline rate averages a representative basket. Your own rate depends on what you actually buy.
- Every rate here is an illustrative round number. For real figures, use your national statistics office.
Most people file inflation under "economy" rather than under "my money". The link is more direct than that. If you are holding a sum for a defined purpose, a house deposit, a car, a year of school fees, inflation is the rate at which that purpose gets more expensive while your pot stands still. This is general information rather than financial advice; a regulated adviser is the right person for a decision about your own money.
For the measured rate where you live, go to the source rather than a headline: the UK publishes consumer price statistics through the Office for National Statistics, the US through the Bureau of Labor Statistics, and every developed economy has an equivalent body. Everything below uses labelled illustrative rates instead, because the mechanism is what is worth learning and the mechanism does not change.
What a fixed sum is worth after 5, 10, 20 and 30 years
Here is the core table. Take 10,000 units of currency and let it sit, earning nothing, while prices rise at a steady illustrative rate. The figures show what that untouched 10,000 would buy later, in today's money, rounded to the nearest whole unit. The currency does not matter; the arithmetic is identical for dollars, pounds or euros.
| Illustrative inflation rate | After 5 years | After 10 years | After 20 years | After 30 years |
|---|---|---|---|---|
| 2% a year | 9,057 | 8,203 | 6,730 | 5,521 |
| 3% a year | 8,626 | 7,441 | 5,537 | 4,120 |
| 4% a year | 8,219 | 6,756 | 4,564 | 3,083 |
| 5% a year | 7,835 | 6,139 | 3,769 | 2,314 |
| 6% a year | 7,473 | 5,584 | 3,118 | 1,741 |
| 8% a year | 6,806 | 4,632 | 2,145 | 994 |
The formula behind every cell is real value = amount / (1 + rate) ^ years. At 3% for 20 years that is 10,000 / 1.03^20, or 5,537. Nothing was taken out; the balance still reads 10,000. It simply buys a little over half of what it did.
Read it by column. Over five years even the higher rates look survivable, which is why short-term cash rarely feels damaged. Over thirty years the same rates are brutal, because erosion compounds against you exactly the way interest compounds for you. The 8% row is a deliberate high illustration, not a forecast: a rate that sounds like a modest single digit removes about 90% of purchasing power across a working lifetime. The inflation calculator runs the same sum for any figure and period.
Turning it around: what you would need later
The same relationship reads from the other end, and this version is often more persuasive. Instead of asking what 10,000 will buy later, ask what you would need later to buy what 10,000 buys today: future amount = amount x (1 + rate) ^ years.
| Illustrative inflation rate | In 5 years | In 10 years | In 20 years | In 30 years |
|---|---|---|---|---|
| 2% a year | 11,041 | 12,190 | 14,859 | 18,114 |
| 3% a year | 11,593 | 13,439 | 18,061 | 24,273 |
| 4% a year | 12,167 | 14,802 | 21,911 | 32,434 |
| 5% a year | 12,763 | 16,289 | 26,533 | 43,219 |
| 6% a year | 13,382 | 17,908 | 32,071 | 57,435 |
| 8% a year | 14,693 | 21,589 | 46,610 | 100,627 |
The two tables are the same statement inverted. At an illustrative 4% over 20 years, 10,000 held as cash falls to 4,564 in purchasing power, and it would take 21,911 to buy what 10,000 buys now.
This is the version to use for goals with a deadline. If you are costing something twenty or thirty years out, a retirement income being the obvious case, the price tag in your head today is not the one you will face. The method is set out in how to calculate purchasing power, and the target-setting side in how much do I need to retire.
The rule of 72, applied to erosion rather than growth
The rule of 72 is usually taught as a growth shortcut: divide 72 by the annual return to estimate how many years an investment takes to double. It works just as well pointed at inflation. Divide 72 by the inflation rate for roughly how long until prices double, which is the same as saying purchasing power halves.
| Illustrative rate | Rule-of-72 estimate | Exact answer | Difference |
|---|---|---|---|
| 2% a year | 36.0 years | 35.0 years | 1.0 year too long |
| 3% a year | 24.0 years | 23.4 years | 0.6 years too long |
| 4% a year | 18.0 years | 17.7 years | 0.3 years too long |
| 5% a year | 14.4 years | 14.2 years | 0.2 years too long |
| 6% a year | 12.0 years | 11.9 years | 0.1 years too long |
| 8% a year | 9.0 years | 9.0 years | negligible |
The exact figure is ln(2) / ln(1 + rate). The shortcut is most accurate around 8% and drifts at low rates, always erring slightly long, which is the safer direction to be wrong in. For mental arithmetic it is good enough: at an illustrative 3% prices double in roughly a generation, at an illustrative 6% in roughly a decade.
The important move is applying it to the gap rather than to inflation alone. If your money earns an illustrative 2% while prices rise at 4%, purchasing power falls about 1.9% a year, because 1.02 / 1.04 - 1 = -0.0192. Divide 72 by 1.9 and you get about 38 years to halve, against an exact 35.7. Interest slowed the erosion; it did not stop it. More on the shortcut's derivation and limits in the rule of 72.
Why "cash is safe" is only true in nominal terms
Cash is genuinely safe in one sense: the number does not fall. Deposit 10,000 and you still have at least 10,000 next year. This is why cash suits money you need soon and cannot afford to see drop, an emergency fund being the standard case, covered in how to build an emergency fund.
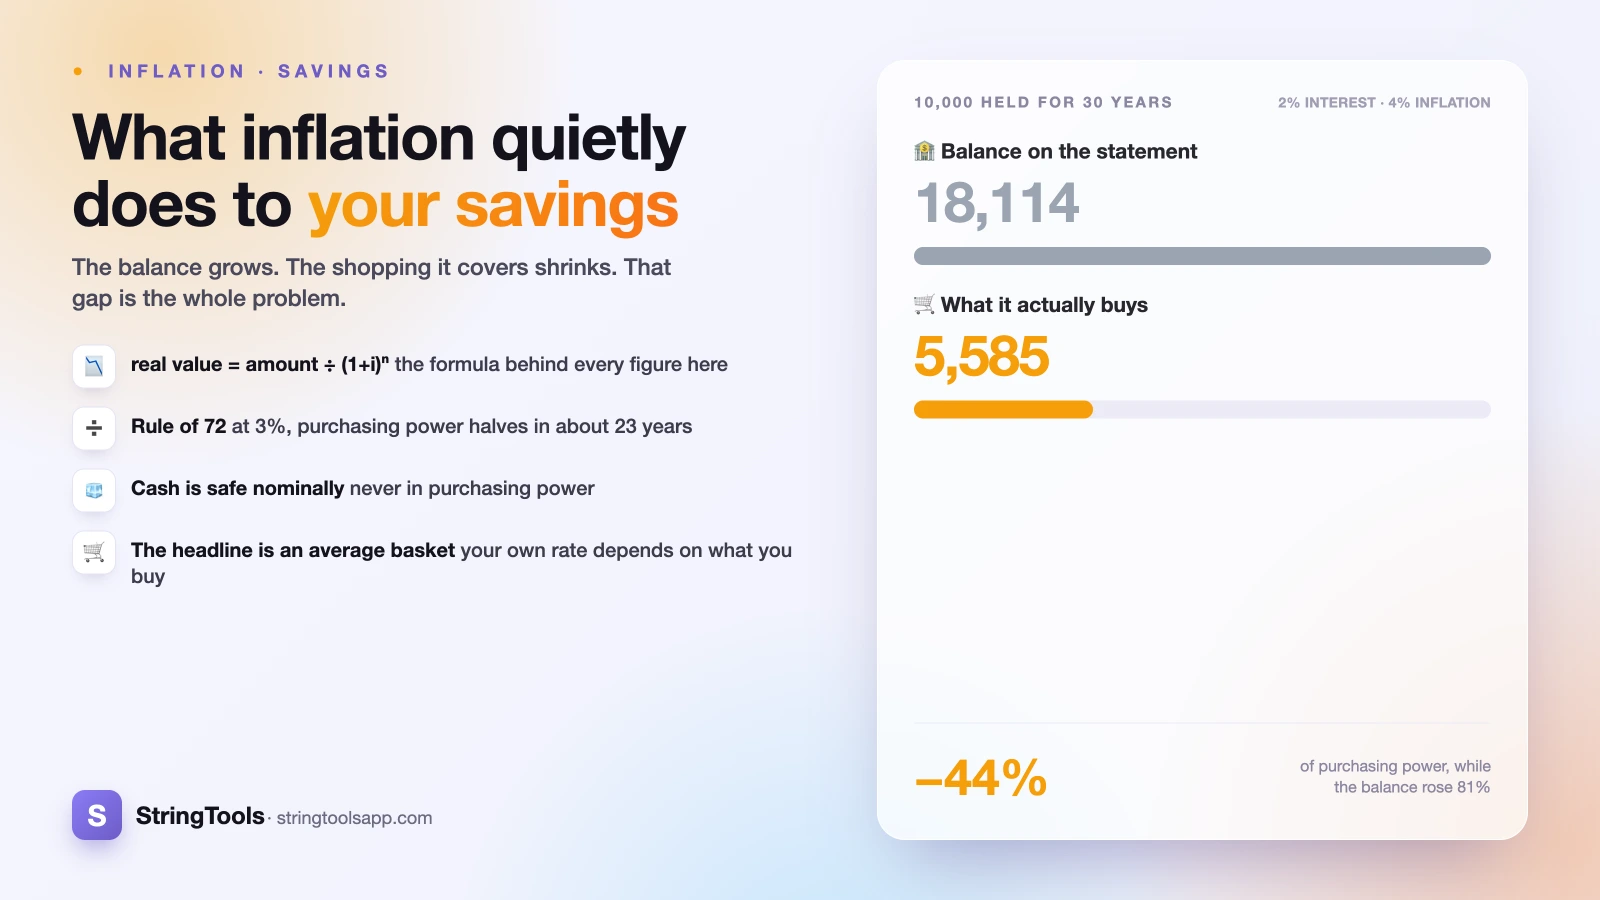
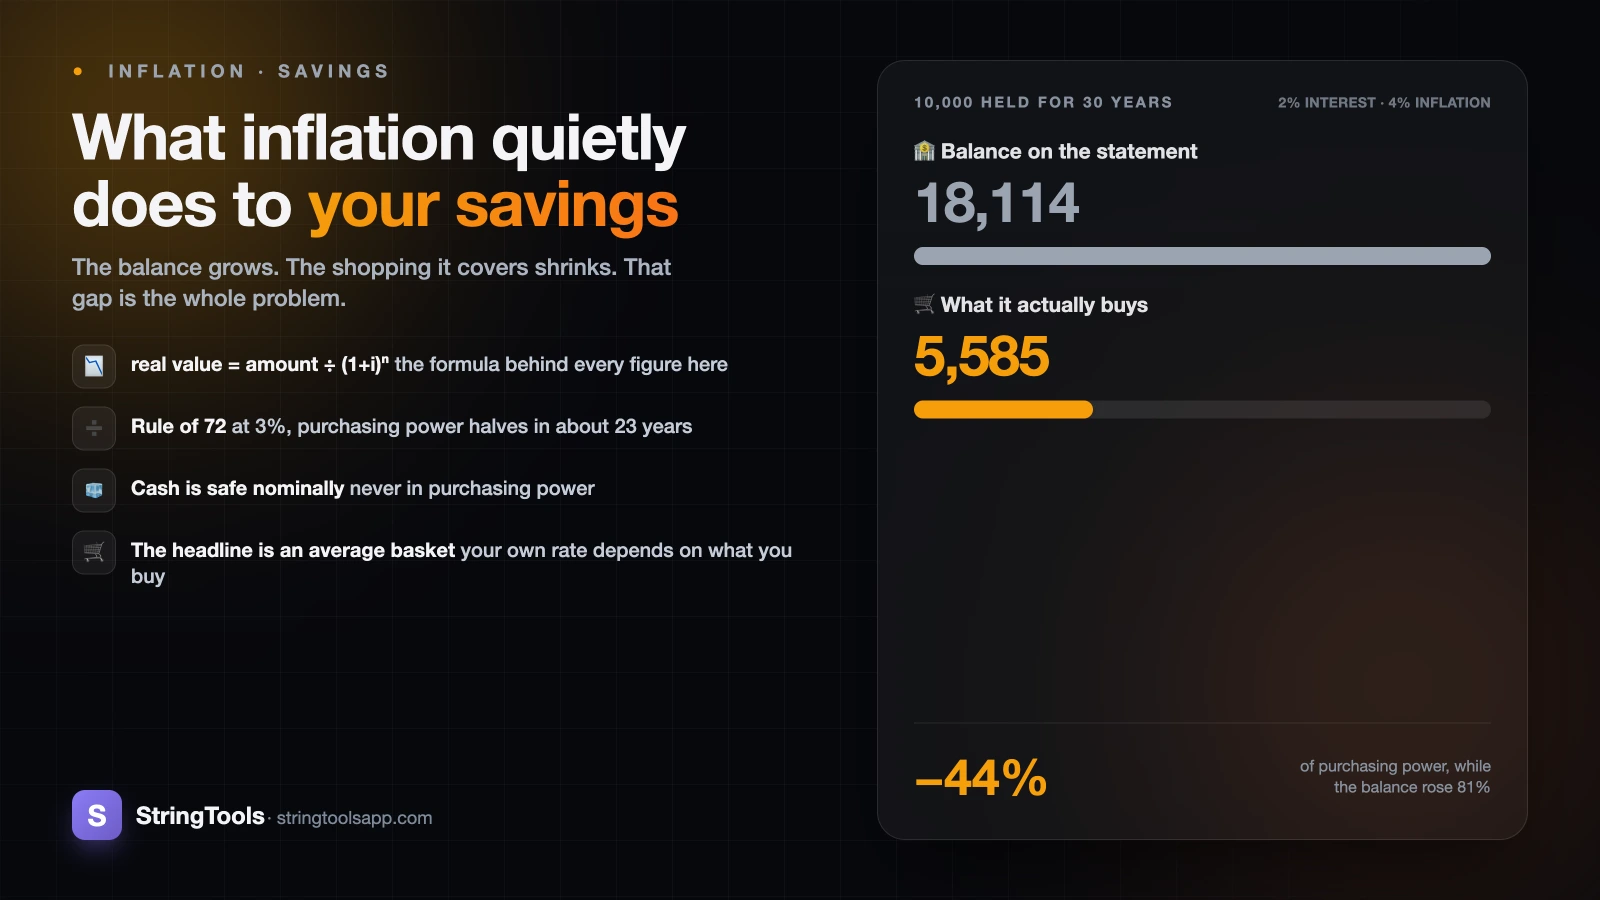
The safety is nominal only. Watch a savings account paying an illustrative 2% while prices rise at an illustrative 4%, starting from 10,000, interest compounding and nothing withdrawn.
| Years | Balance on the statement | What it buys, in today's money |
|---|---|---|
| 5 | 11,041 | 9,075 |
| 10 | 12,190 | 8,235 |
| 20 | 14,859 | 6,782 |
| 30 | 18,114 | 5,585 |
The left column is what you see when you log in: it rises every year and the account looks like it is working. The right column is what actually happened. After thirty years the balance is up more than 80% and purchasing power is down by nearly half. Nobody sends a statement for the right-hand column, which is why this goes unnoticed for decades.
A nominal return is the headline percentage; a real return is what is left after inflation. Real vs nominal returns works through the conversion, including why subtracting inflation from the interest rate is an approximation rather than the exact answer. The exact form is real return = (1 + nominal) / (1 + inflation) - 1, and you can run scenarios with the compound interest calculator.
None of this makes cash a mistake. It makes cash a tool with a known cost that scales with the holding period: money needed within a couple of years is barely affected, money left for twenty years pays a large invisible fee. Returns from any alternative are not guaranteed and past performance does not predict future results, so this is a trade between two kinds of risk, not a free upgrade.
The headline rate is not your rate
Published inflation is the price change of a representative basket, weighted by what households spend on average. Agencies survey spending, assemble the basket, price the same items repeatedly, and update the contents as habits shift. It is careful measurement, and it describes an average household rather than yours.
Your personal rate is the same calculation using your own weights. It diverges from the headline whenever your spending is unusual, and most people's spending is unusual in at least one direction:
- Housing. Renting, owning on a fixed rate, owning on a variable rate or owning outright completely changes how much a move in housing costs touches you.
- Transport. Someone driving long distances daily feels fuel prices in a way a person who walks to work does not.
- Life stage. Childcare, school and university costs, and care costs each dominate a budget for a period and are absent from it entirely at other times.
- Health. Where healthcare is paid for directly, medical price changes can swamp everything else.
- Where you live. Regional differences in rent and services can be large within one country.
A practical test: take last year's spending, group it into six or seven categories, and note the share each takes. If a category with an outsized share of your budget is also rising faster than average, your personal rate is above the headline and the tables above understate what is happening to you. It works the other way too: fixed housing costs and low transport spending can keep someone below the published rate for years.
Statistics offices publish the component detail as well as the headline, which makes this checkable rather than a guess. Both the ONS and the BLS break the index down by category, so you can watch the areas where your budget is concentrated instead of the single number in the news. The Consumer Financial Protection Bureau publishes plain-language budgeting material if you want a framework for the categories.
What the number changes in practice
Knowing the erosion rate does not tell you what to do. What it does is reframe several ordinary decisions.
- Match the holding period to the instrument. The cost of holding cash is proportional to time. Money with a known near-term use is a different problem from money with no date attached.
- Judge a pay rise in real terms. A rise below the rate prices are moving is a pay cut with better presentation.
- Compare savings rates against inflation, not each other. Moving to a slightly better account is a small win. The bigger question is which side of the inflation line either sits on.
- Restate long-term goals in today's money. A target set in future nominal currency is hard to reason about. One set in today's purchasing power, then inflated at the end, is easier to sanity-check.
- Check fixed sums for drift. Anything defined as a flat amount rather than a percentage, an insurance sum insured, a contribution you set years ago, a deductible, quietly shrinks in real terms until someone updates it.
One caution on the tables here. They assume a single steady rate, which is a modelling convenience rather than a description of reality: actual inflation varies year to year, and a long average hides periods well above and below it. Use a steady illustrative rate to see the shape of the effect and compare scenarios, not to predict a balance on a date. Running two or three rates and looking at the spread is more informative than any single line.
Working out your own figure
The arithmetic is small enough to do yourself, and doing it once sticks better than reading about it.
1. Take the amount you are actually holding, not a round illustration.
2. Choose the period you will realistically hold it for, in whole years.
3. Pick two rates rather than one: a low illustrative case and a high one, so you see a range instead of a false point estimate.
4. Divide the amount by (1 + rate) ^ years for each. That is the purchasing power in today's money.
5. Subtract the rate your money is actually earning by using the gap, (1 + interest) / (1 + inflation) - 1, and repeat. The difference between step 4 and step 5 is what the interest is buying you.
The inflation calculator runs all of that from an amount plus either a rate or a pair of years, returning both the purchasing power and the equivalent amount. For the growth side of the same question, the compound interest calculator handles contributions and compounding frequency.
What you should not take from this is a rate to plan around. Nothing here states a current or expected inflation rate, because such a figure would be out of date by the time you read it and would differ by country regardless. Get the measured number from your own national statistics office, model a low and a high case around it, and treat every projection as a range. For a decision that matters, a regulated financial adviser can look at your circumstances in a way no calculator can.
Frequently Asked Questions
Does my money lose value if my savings account pays interest?
It depends entirely on the gap between the interest rate and the inflation rate, not on the interest rate alone. If your account pays less than prices are rising, purchasing power still falls, just more slowly. The exact calculation is real return = (1 + interest) / (1 + inflation) - 1. With an illustrative 2% interest against 4% inflation, that gives about -1.9% a year: the balance grows and buys less at the same time.
How long does inflation take to halve the value of my savings?
Divide 72 by the rate at which your purchasing power is eroding. At an illustrative 3% a year the rule of 72 gives 24 years against an exact answer of 23.4; at an illustrative 6% it gives 12 years against an exact 11.9. If your money is earning interest, apply the rule to the gap between the two rates rather than to inflation on its own, which lengthens the answer considerably.
Is holding cash risky?
Cash carries no nominal risk in a protected deposit account: the number will not fall. It carries real risk, meaning the purchasing power of that number declines whenever inflation exceeds the interest paid. The cost scales with time, so cash is well suited to money needed within a year or two and poorly suited to money left untouched for decades. Alternatives carry their own risks and their returns are not guaranteed.
Why does the official inflation rate not match what I see in the shops?
The published figure is the price change of a representative basket weighted by average household spending. Your basket is not the average one. If housing, transport, childcare or medical costs take an unusually large share of your budget and those categories move faster than the average, your personal rate is higher than the headline. Statistics offices publish the component breakdown, so you can compare the categories that dominate your own spending.
What inflation rate should I assume for planning?
No single figure is safe to hand out, because inflation varies by country and over time. The sound approach is to take the measured rate from your national statistics office, such as the ONS in the UK or the BLS in the US, then model a low and a high scenario around it rather than a single number. Looking at the spread between two illustrative rates tells you far more than any point estimate.
How do I convert a future amount back into today's money?
Divide by (1 + rate) ^ years. A sum of 10,000 in twenty years at an illustrative 4% is worth 10,000 / 1.04^20, or about 4,564 in today's purchasing power. To go the other way, multiply instead: matching what 10,000 buys today would take about 21,911 in twenty years at that same illustrative rate.
Sources and references
Office for National Statistics (ons.gov.uk) · Bureau of Labor Statistics (bls.gov) · Consumer Financial Protection Bureau (consumerfinance.gov). Content was reviewed against these sources as of the last-updated date above; external figures and rules may change after publication.