
Ranked by what they cost, not by how often they get listed
The costliest retirement saving mistakes are, in order: starting a decade late, paying an extra 1% a year in fees, holding everything in cash while you are young, never claiming an employer match, cashing out a plan when you change jobs, and ignoring inflation. Timing and fees dominate, because both compound.
Key Takeaways
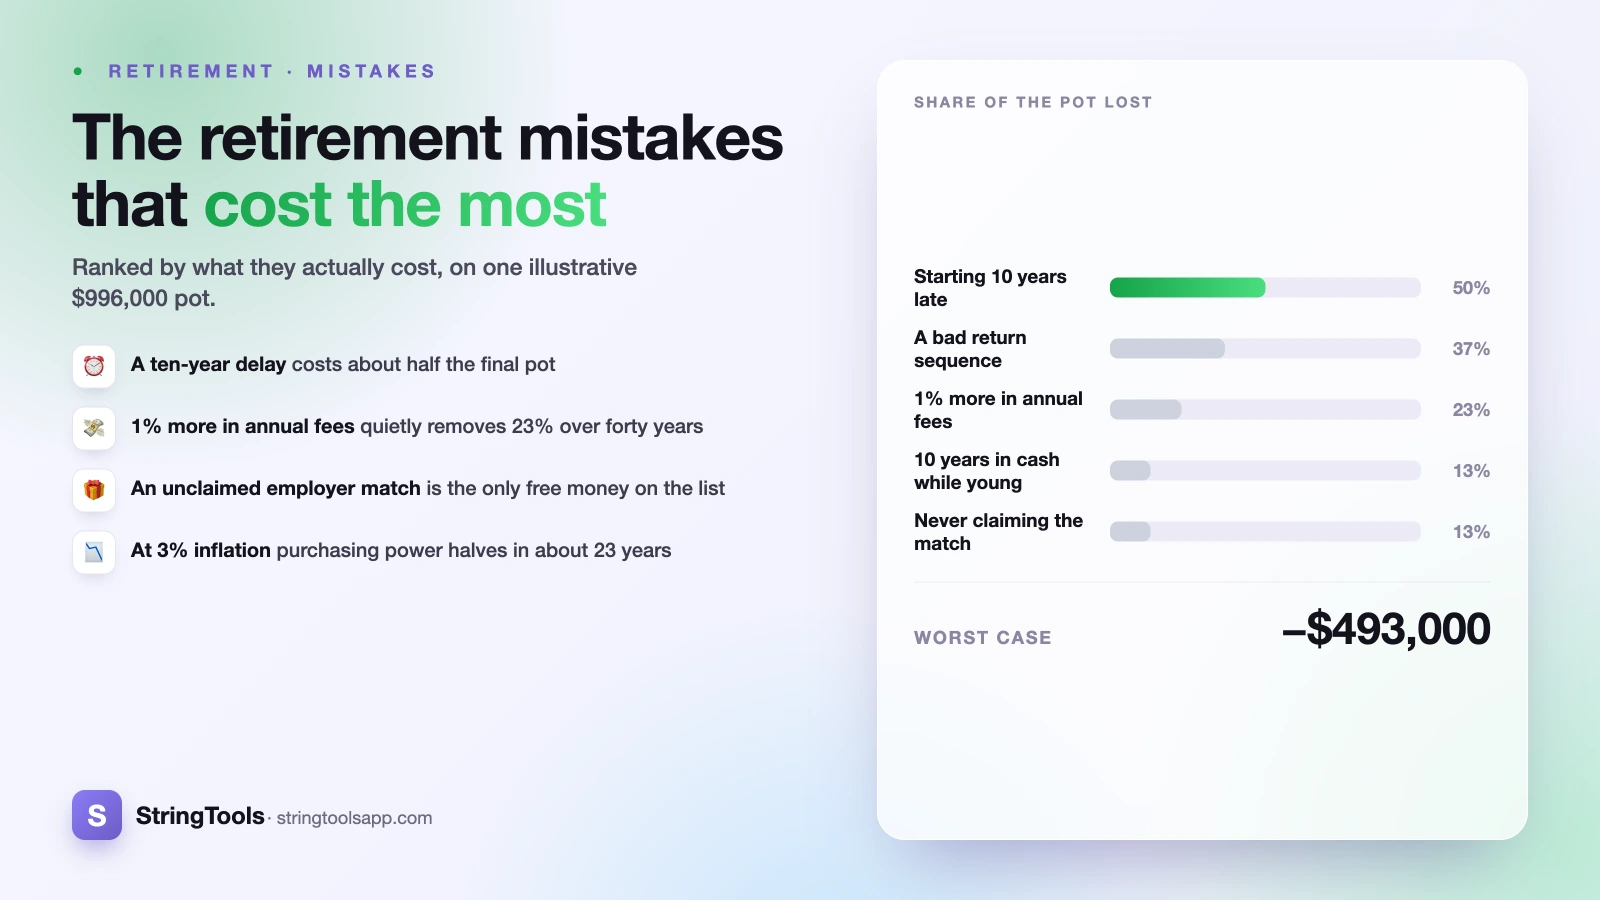
- A ten-year delay costs roughly half the final pot, even though it only costs you a quarter of the contributions.
- A 1% annual fee difference is invisible month to month and removes around 23% of a forty-year pot.
- The employer match is the only part of this list that is free money, and it is usually the easiest to fix.
- Being too cautious at 25 and too exposed at 64 are the same mistake pointing in opposite directions.
- At 3% inflation, purchasing power halves in about 23 years, which is well inside a normal retirement.
- This is general information, not financial advice. A regulated adviser is the right person for a decision about your own money.
None of these are failures of character. Each is an ordinary decision made with incomplete information, usually while something more urgent was happening. The point of ranking them is that limited attention should go to the expensive ones first.
The cost table, and the assumptions behind it
So that nothing here quietly contradicts anything else, every figure in this article comes from one illustrative model. It is not a prediction and not a recommendation.
- Someone saves $500 a month from age 25 to age 65 — forty years, $240,000 of contributions.
- The investments grow at 6% a year, assumed constant, purely to keep the arithmetic legible.
- Contributions never rise, and tax is ignored.
- Monthly contribution streams are compounded monthly at 6%/12; one-off lump sums are compounded annually at 6%. That is the ordinary convention for each, and it is why a stream and a lump sum quoted at "the same 6%" do not scale identically.
On those assumptions the pot reaches about $996,000. Real returns are not constant and not guaranteed, and past performance does not predict future results — a real forty-year period contains crashes and recoveries in an order nobody can forecast. The currency is arbitrary; the proportions carry over. To run the same shape on your own numbers, the retirement calculator takes your age, balance and monthly contribution, and the compound interest calculator tests one variable at a time.
All rows use that model unless the row says otherwise. Rounded to the nearest thousand.
| Mistake | What it looks like in practice | Rough long-run cost |
|---|---|---|
| Starting ten years late | First contribution at 35 instead of 25 | ~$493,000 (about half the pot) |
| A bad sequence near the end* | A 20% fall in the first two years of retirement instead of the last two | ~$373,000 less left after 25 years |
| Paying 1% more a year in fees | 5% net instead of 6% net, for forty years | ~$233,000 (about 23% of the pot) |
| Ten years in cash while young | Contributions earn 1% until 35, then 6% | ~$131,000 |
| Never claiming an employer match** | A 3% match on a $50,000 salary, unclaimed for 30 years | ~$126,000 |
| Cashing out on a job change | Taking $10,000 at age 30 instead of transferring it | ~$77,000 by 65, before tax and penalties |
| Ignoring inflation | 3% a year over a long retirement | Purchasing power halves in ~23 years |
*Sequence row uses a different base: a $500,000 pot at retirement, drawing $20,000 a year for 25 years, with the same set of annual returns in two different orders.
**Match row uses the match money only ($125 a month), growing at 6% for 30 years.
Two things stand out. First, the top of the table is about when, not how much. Second, the two most expensive items — the delay and the fee — are the two you are least likely to notice while they are happening.
Starting late: the ten years you cannot buy back
Start at 25 and $500 a month becomes about $996,000 by 65. Start at 35 and the same $500 a month becomes about $502,000. The delay costs roughly $493,000, or 49.6% of the pot.
The asymmetry is the counter-intuitive part. Ten years of delay removes $60,000 of contributions — a quarter of what you would ever have paid in — but half the outcome. The first decade's money is the only money that compounds for the entire forty years. Money paid in at 55 has ten years to work; money paid in at 25 has forty.
What catching up actually costs
A 35-year-old who wants to reach the same $996,000 by 65, on the same 6% assumption, needs about $991 a month instead of $500. Not 25% more, to match the missing contributions — very nearly double, for the whole remaining thirty years.
This is the single strongest argument for starting with an amount that feels almost too small to bother with. $50 a month started now beats $500 a month started in eight years' time in every version of this arithmetic, because the variable doing the heavy lifting is time in the market rather than the size of the payment. How much you should have saved at each age is a useful sanity check, but treat it as a direction of travel, not a scoreboard.
If you are already past 25 — which is most people reading this — the useful reading of these numbers is not regret. It is that the same logic applies to the next ten years as applied to the last ten.
The employer match: the only free money on the list
Where an employer matches part of what you pay into a workplace plan, the match is additional compensation paid only if you contribute enough to trigger it. Not contributing enough is, in cash terms, declining part of your salary.
On a $50,000 salary with a 3% match, the unclaimed amount is $1,500 a year — $125 a month. Left uninvested for thirty years at 6%, that match money alone would have been worth about $126,000. Over forty years it is closer to $249,000.
This is rarely missed because people do not want the money. The reasons are mundane:
- The default contribution rate at enrolment sits below the match threshold, and nobody changes it.
- The rules are stated as "50% of the first 6%", which is hard to parse under time pressure.
- Someone opted out during a tight month and never opted back in.
- A job change reset the rate to the new employer's default.
The fix is a five-minute check of your current contribution rate against your plan's match threshold. Do it after every pay rise and every job change, because both reset the arithmetic. In the US, plan disclosures and your rights around them are covered by the Consumer Financial Protection Bureau and the SEC's Investor.gov; in the UK, MoneyHelper explains how auto-enrolment and employer contributions interact.
Cashing out when you change jobs
When you leave a job, the balance in that employer's plan has to go somewhere: stay put, move to the new employer's plan, or move to an individual account. Taking it as cash is often the path of least resistance, especially when the balance looks small.
$10,000 taken at 30 and spent, rather than transferred, would have been worth about $76,900 at 65 on the 6% assumption. That is before the immediate cost — depending on the country and the plan type, a cash-out can trigger income tax, an early-withdrawal penalty, or the loss of tax-advantaged status on money that can never be put back inside the wrapper.
Why small balances are the ones that get cashed out
The balance is smallest at exactly the point when it has the most time left to grow. A $3,000 balance at 28 does not feel like retirement money; on these assumptions it is around $25,900 at 65.
Transfer rules, penalties and deadlines differ by country and plan type, and they change. Check with your plan administrator and your national tax authority before moving anything — this is one of the few places where getting the paperwork order wrong has an immediate, irreversible tax cost.
The 1% you never see leave the account
Fees are deducted inside the fund or plan, so they never appear as a transaction. Nothing leaves your bank account. What changes is the growth rate — exactly the variable compounding is most sensitive to.
Take the same $500 a month for forty years. At 6% net the pot is about $995,700. At 5% net — the same investments, one percentage point more in annual charges — it is about $763,000. The difference is about $232,700, or 23.4% of the final pot, produced by a number that looks like a rounding error on a statement.
| Net annual return | Pot after 40 years ($500/mo) | Difference vs 6% |
|---|---|---|
| 6.0% | ~$995,700 | — |
| 5.5% | ~$870,500 | ~$125,200 |
| 5.0% | ~$763,000 | ~$232,700 |
| 4.0% | ~$591,000 | ~$404,700 |
The effect scales with time, not with balance, which is why it matters most to the youngest savers — the people least likely to be reading fund factsheets. On a lump sum the arithmetic is even blunter: $100,000 left for thirty years grows to about $574,300 at 6% and about $432,200 at 5%. Same money, same thirty years, about $142,100 of difference.
What to actually look at
- The total cost, not just the fund charge: platform or administration fee plus fund charge plus any adviser fee.
- Whether an actively managed option's extra charge is being justified by anything you can identify.
- Whether an old plan from a previous employer is sitting on a higher-cost, older fund range.
This is not an argument that the cheapest option is always right. It is an argument that a 1% difference is a $233,000 decision dressed up as a 1% decision, and deserves looking at once rather than never.
Wrong risk at the wrong end: too cautious young, too exposed late
These get listed as two mistakes. They are one mistake — holding a level of risk that does not match how many years the money has left to recover — pointing in opposite directions.
Too conservative too young
A 25-year-old holding everything in cash has removed the volatility and also removed the growth. If the first ten years of contributions earn 1% and everything after that earns 6%, the pot ends at about $864,500 instead of $995,700 — about $131,000 less, from a decision that felt like the safe one. Ten years is long enough for markets to have recovered from most historical falls, which is precisely why a long horizon is what makes volatility tolerable.
Too aggressive too close to the end
At the other end, the risk is not volatility itself but when it arrives. If a fall happens while you are drawing an income, you sell units at the bottom to fund the withdrawal, and those units are not there for the recovery. This is called sequence-of-returns risk.
Here is the same set of returns in two different orders. A $500,000 pot, drawing $20,000 a year, over 25 years, with twenty-three years at 5% and two years at −20%:
| Order of returns | Balance left after 25 years |
|---|---|
| The two −20% years last | ~$416,600 |
| The two −20% years first | ~$43,700 |
Identical returns. Identical withdrawals. A gap of about $373,000, decided entirely by sequence. This is the mechanism behind the conventional practice of reducing risk as the drawdown date approaches, and behind holding a cash buffer so that early withdrawals do not have to be funded by selling into a fall.
What the right level is at any given age depends on your other income, your other assets and how much variability you can actually live with — which is a personal question, not a formula. Investor.gov covers the general principles of matching risk to time horizon. Working out when you can afford to retire is the piece of this that most changes the answer, because it sets how many years the money has to last.
Inflation: the mistake that only shows up after you stop working
The other items on this list are about building the pot. This one is about what the pot buys, and people discover it late because it has no single moment of decision.
At 3% inflation, prices double in about 23 years. Purchasing power does the reverse: $1 of income today buys about 48 cents of goods after 25 years. A retirement income of $40,000 a year needs to be about $83,800 after 25 years to buy the same basket. At 2% the halving takes about 35 years, and $40,000 needs to be about $65,600 after 25 years.
| Inflation rate | Years for prices to double | What $1 buys after 25 years |
|---|---|---|
| 2.0% | ~35 | ~$0.61 |
| 2.5% | ~28 | ~$0.54 |
| 3.0% | ~23 | ~$0.48 |
A retirement starting at 65 can easily run 25 or 30 years, so this is the base case, not a tail risk. Two consequences follow. First, a retirement income target stated in today's money needs to be inflated to the year you will actually retire before you can judge whether the pot is big enough. Second, an all-cash portfolio in retirement is not the risk-free option it appears to be; it simply converts market risk into a slow, certain erosion. Whether your national state pension or social security payment rises with inflation, and by what measure, varies by country and is worth checking with the relevant authority rather than assuming. Actual inflation rates change constantly — use current figures from your national statistics office rather than the illustrative ones above.
For sizing a target that already accounts for this, see how much you need to retire.
If you have already made some of these
Most people reading a list like this will recognise three or four of them. The useful question is not which ones you made but which ones are still open, because they differ enormously in how recoverable they are.
| Mistake | Still fixable? | The actual next step |
|---|---|---|
| Unclaimed employer match | Fully, today | Check your contribution rate against your plan's match threshold |
| High fees | Fully, this month | Add up the total annual cost on every plan you hold, including old ones |
| Too cautious for your age | Fully | Review the allocation against how many years until you draw on it |
| Old plans left behind | Usually | Locate them; decide whether to consolidate |
| Too exposed near retirement | Yes, while you still have runway | Plan the de-risking glide path and a cash buffer before you need it |
| A past cash-out | No | Nothing to do; the money is gone. Redirect the attention |
| Years not saved | No, but | Every remaining year still has the same compounding logic |
If you only have one afternoon: claim the match first, because it is free and immediate; total your fees second, because the number is usually a surprise; check your allocation third. Locating old plans is worth doing but takes weeks of correspondence, so start it and let it run in the background.
One closing observation. The two most expensive rows in the table — the delay and the fee — are the two with the fewest visible symptoms. Nothing goes wrong on the day you do not start saving, and nothing goes wrong on the day a 1% charge is applied. The mistakes with the loudest symptoms, such as a market fall in the news, are usually not the ones doing the most damage. That is the real reason lists like this exist: the costs are invisible in the moment and only legible in aggregate, decades later.
This article is general information, not financial advice. It recommends no product, provider or allocation, and the figures are illustrative rather than predictive. For a decision about your own money, a regulated financial adviser who can see your full position is the right person to ask.
Frequently Asked Questions
How much does starting retirement savings ten years late actually cost?
On an illustrative model — $500 a month, 6% a year, retiring at 65 — starting at 35 instead of 25 produces about $502,000 instead of about $996,000. The delay costs roughly $493,000, close to half the pot, from only $60,000 of missed contributions. To reach the same total starting at 35 you would need about $991 a month rather than $500, for the full thirty years. Returns are not guaranteed and this is not a prediction.
Does a 1% difference in fees really matter that much?
Yes, because it changes the compounding rate rather than the balance. On the same $500 a month over forty years, 6% net produces about $995,700 and 5% net produces about $763,000 — a difference of about $232,700, or 23.4% of the pot. The effect grows with time rather than with balance, so it matters most to the youngest savers. Look at total cost: platform or administration fee, plus fund charge, plus any adviser fee.
What is sequence-of-returns risk in plain English?
It is the risk that a market fall arrives early in your retirement rather than late. When you are drawing an income, a fall means you sell units at depressed prices to fund the withdrawal, and those units are not there for the recovery. In the worked example above, a $500,000 pot drawing $20,000 a year over 25 years ends with about $416,600 if two bad years come last, and about $43,700 if the same two bad years come first.
Should I cash out a small pension pot when I change jobs?
Cashing out is usually the most expensive option available, because it costs both the immediate tax or penalty and all the future growth. $10,000 taken at 30 would have been about $76,900 at 65 on a 6% assumption. Small balances are the ones most often cashed out and the ones with the most time left to grow. The transfer rules, penalties and deadlines differ by country and plan type — check with the plan administrator and your national tax authority before moving anything.
Is holding cash a safe way to save for retirement?
It removes market volatility and replaces it with inflation erosion. At 3% inflation, purchasing power halves in about 23 years, which is well inside a typical retirement. In the illustrative model, holding the first ten years of contributions in cash at 1% instead of investing them costs about $131,000 by 65. Cash has a genuine role as a buffer, particularly close to and during drawdown, but as a forty-year growth strategy it converts one risk into another.
I am in my 40s and behind. Which mistake should I fix first?
Fix the reversible ones in order of speed and certainty. Claim any employer match you are not currently triggering — that is free money available today. Then total the annual fees across every plan you hold, including old ones from previous employers, because that number is often a surprise. Then check whether your allocation matches how many years remain before you draw on it. Past cash-outs and years not saved cannot be recovered, so they are not worth attention.
Sources and references
Consumer Financial Protection Bureau (consumerfinance.gov) · Investor.gov (investor.gov) · MoneyHelper (moneyhelper.org.uk). Content was reviewed against these sources as of the last-updated date above; external figures and rules may change after publication.