
The short answer, by age
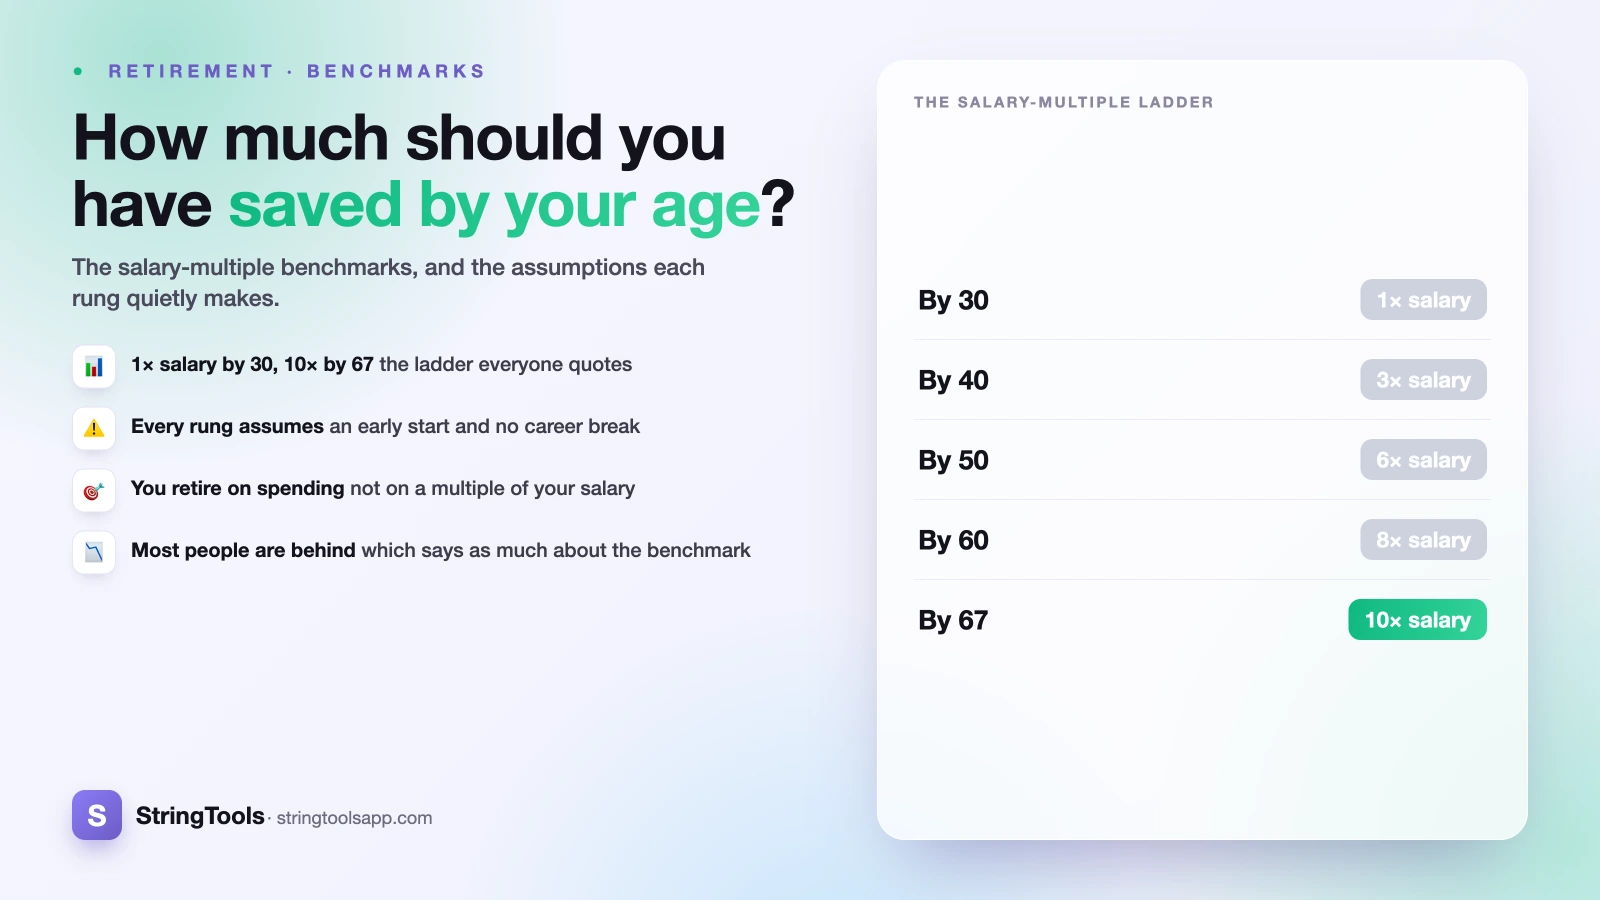
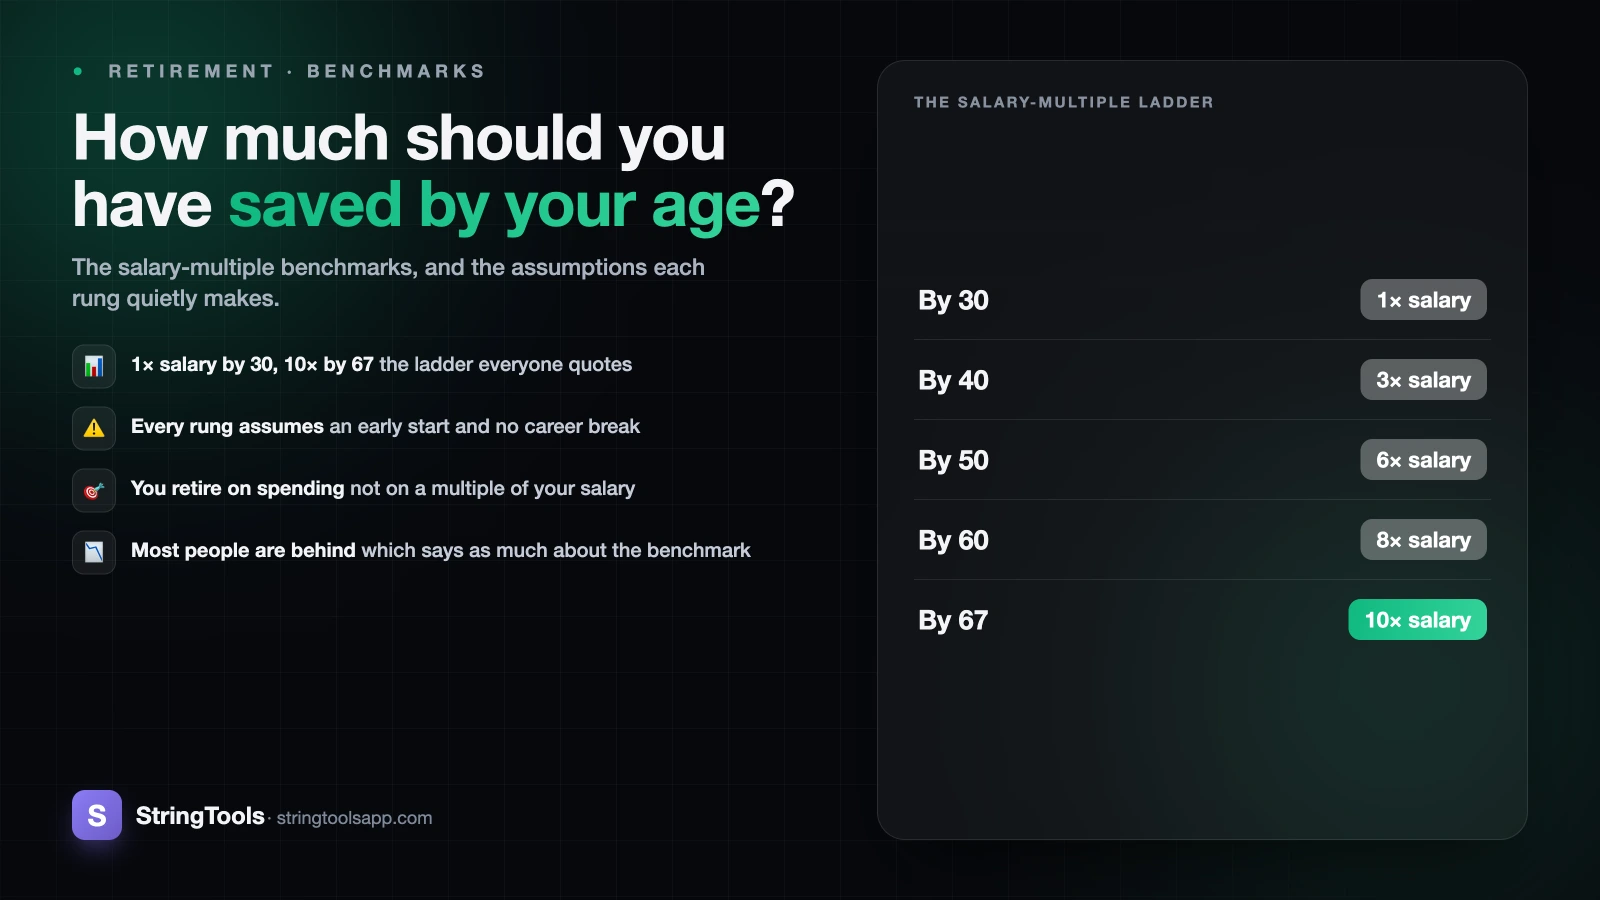
Widely published rules of thumb suggest having roughly 1x your salary saved by 30, 3x by 40, 6x by 50, 8x by 60 and 10x by the time you stop work. They are rough guides, not targets set by any regulator, and they assume a steady career, an early start and decades of investment growth.
Key Takeaways
- The salary-multiple benchmarks are a sense check, not a plan. Nobody retires on a multiple; they retire on a pot that pays an income.
- Every multiple hides four assumptions: your salary keeps rising, you never stop contributing, markets grow, and you retire at a conventional age.
- The three things that actually decide your number are the income you want, the age you stop earning, and how many years the money has to last.
- A state or public pension does part of the work in most countries, which is why a bare salary multiple over-states the private saving some people need and under-states it for others.
- Most people are behind these benchmarks. That is a statement about the benchmarks as much as about the people.
- Being behind at 45 is a problem you can still act on. Being behind and doing nothing is the only version that compounds.
The question "how much should I have saved by now?" is really two questions wearing one coat. The first is factual: what does the arithmetic of my own retirement require? The second is emotional: am I doing badly? Salary multiples answer the second question loudly and the first one badly, which is why they are everywhere and why they leave so many people either falsely reassured or quietly panicking.
This post takes the benchmarks seriously enough to show you exactly what they assume, then replaces them with something you can actually check against your own numbers. None of this is financial advice — it is general information, and a regulated adviser is the right person for a decision about your own money.
The benchmark table, and what each rung assumes
Here are the salary multiples as they are usually published, with the assumption behind each one made explicit. Read the right-hand column first. It is the part that gets left out.
| Age | Commonly cited target | What that rung quietly assumes |
|---|---|---|
| 30 | About 1x salary | You started contributing in your early-to-mid twenties and have had 5-8 years of payroll saving, including any employer match |
| 35 | About 2x salary | Contributions continued through a period when many people are buying a home or paying childcare |
| 40 | About 3x salary | Roughly 15 years of saving plus market growth on the earliest contributions, which have had the longest to compound |
| 45 | About 4x salary | Your salary has risen, so the multiple is being applied to a bigger number — the pot has to grow faster just to hold the ratio |
| 50 | About 6x salary | The jump from 4x to 6x is mostly compounding, not saving harder; it assumes you stayed invested through at least one bad market |
| 55 | About 7x salary | Peak earnings, children becoming independent, and no career break, redundancy or long illness in the previous decade |
| 60 | About 8x salary | You are still five to seven years from stopping, and you have not started de-risking so far that growth has stalled |
| 67 | About 10x salary | You retire at a conventional state-pension-ish age, and a state or workplace pension covers part of your spending on top of this pot |
Two things follow from that column. First, the multiples are a description of what a long, uninterrupted, well-matched savings career produces — not a prescription anyone derived from your circumstances. Second, they are built around a salary, but you will retire on spending, and the two diverge sharply for anyone who saves a lot, earns commission, or expects a mortgage to be gone by then.
Where the multiples come from, and why they are crude
Salary multiples are a communication device. Large pension providers and financial publishers need a single number that a 34-year-old can hold in their head, and "three times salary by forty" travels further than a page of assumptions. Reverse-engineer any published set and you find the same skeleton underneath: a target replacement income of roughly 70-80% of pre-retirement pay, a withdrawal rate in the region of 4% a year, a state pension filling part of the gap, and a steady real return on the invested pot. Change any one of those inputs and the whole ladder moves.
The crudeness shows up in four places.
- They are anchored to salary, not spending. Someone earning £70,000 who lives on £35,000 needs far less than 10x salary. Someone who spends every pound of a £40,000 salary needs more than the multiple suggests.
- They ignore where you live. Public pension provision, healthcare costs and tax treatment differ enormously between countries. The UK's arrangements are set out at GOV.UK's State Pension guidance; the US equivalent is the Social Security Administration. A rule of thumb built for one system silently mis-states the other.
- They assume a straight line. Career breaks, caring responsibilities, self-employment, illness and redundancy are normal, and every one of them dents a multiple that was calculated as though they do not happen.
- They say nothing about the shape of your retirement. Stopping at 55 and stopping at 68 are different problems with different answers, and no single multiple can hold both.
None of that makes the benchmarks useless. A 45-year-old with 0.5x salary saved has learned something real from the fact that the published figure is 4x. It just is not the answer — it is the prompt to go and work the answer out.
The three things that actually set your number
Strip the rules of thumb away and only three inputs matter.
1. The income you want, after tax
Not your salary — your spending. Take your current annual outgoings, then adjust for what genuinely changes. Commuting, work clothes and pension contributions themselves usually stop. A mortgage may end. Health and heating costs often rise. Most people land somewhere between 60% and 85% of their pre-retirement spending, but the only figure worth planning on is the one you build from your own budget.
2. When you stop earning
Retiring five years earlier is a double hit: five fewer years of contributions and compounding, and five extra years the pot must fund. It is the single most powerful lever in the whole calculation, and it is usually the one people underestimate. Working two more years often does more for a plan than a heroic increase in contributions.
3. How long the money must last
A plan that runs out at 82 is not a plan. Life expectancy at 65 is materially higher than life expectancy at birth, because you have already survived everything that happens before 65 — a point people routinely miss when eyeballing their own longevity. Planning to something like 95 costs you very little if you die earlier and saves you everything if you do not.
Combine the three and you get a target pot rather than a multiple. The conventional shortcut is 25 times your annual withdrawal, which comes from the 4% withdrawal rate — the logic, and the serious arguments against it, are covered in how much do I need to retire and in more detail in what the 4% rule actually says. Subtract whatever state or defined-benefit pension income you expect, and what remains is the job your own savings have to do.
Most people are behind. That is not a reason to stop.
Where national bodies and large providers publish median retirement balances, those medians commonly sit below the published benchmarks at most ages. We are not citing a specific study here, because the figures differ by country, by year and by how each survey defines a "balance" — look up the most recent release from your own national statistics office or pensions regulator rather than trusting a number quoted in a blog. The gap is largest in the forties and fifties, exactly where the multiples climb fastest. If you have just worked out that you are behind, you are in the ordinary majority, not the failing minority.
It helps to understand why the gap is so consistent. The benchmarks are calibrated on a full contribution history starting in the twenties, and they are expressed against a salary that rises over a career — so a pay rise pushes your target up on the same day it arrives. Career breaks, self-employment years with no employer match, and periods when the mortgage and childcare took everything all leave permanent dents. The benchmark never had a mechanism for any of that.
What the arithmetic says next is genuinely more encouraging than the panic suggests:
- Contributions dominate early; growth dominates late. In your twenties, almost all of your balance is money you put in. By your fifties, a large share of a well-established pot is growth on money you contributed long ago.
- Raising a contribution rate is permanent, and it compounds. A three-point increase held for twenty years changes an outcome far more than a one-off lump sum.
- Delaying retirement adds years of contributions, years of growth, and removes years of drawdown at the same time.
- Cutting planned retirement spending lowers the target pot by 25 times the annual reduction, using the same shortcut above. Trimming £2,000 a year of planned spending cuts roughly £50,000 off the target.
That last point is the one people miss. You can attack the target from the spending side as well as the saving side, and for someone starting late the spending side is often the faster lever.
Checking the benchmark against your own numbers
A multiple tells you where you stand relative to a stranger's assumptions. A projection tells you where your own contributions are heading. The second is the one worth doing, and it takes about five minutes.
The retirement calculator takes your age, what you have saved now, what you put in each month, an expected annual return and your target retirement age, then projects the pot and the income it could support. Run it three times rather than once:
- A conservative run. Use a modest real return and your current contribution. This is your floor.
- A realistic run. Your actual contribution including any employer match, and a return assumption you would defend out loud.
- A stress run. Retire two years earlier, or knock two percentage points off the return, and see how much of the plan survives.
If the three runs land in wildly different places, the plan is more fragile than a single number would ever have shown you. That is the useful output — not the headline figure, but the spread.
It is worth understanding the engine underneath before you trust any projection. Returns are not guaranteed, past performance does not predict future results, and a projection is arithmetic on assumptions rather than a forecast. The US regulator's investor education site, Investor.gov, is a good plain-English source on how compounding and fees interact, and the compound interest calculator shows the same mechanism in isolation. If your question is the narrower one — what monthly amount gets me there — that is worked through in how much to save each month for retirement.
Four checkpoints worth more than a salary multiple
If you throw the multiples away, replace them with these. They are harder to say at a dinner party and considerably more informative.
1. Your contribution rate, including the match. The percentage of gross pay going into long-term savings is the number you control directly, and it predicts outcomes better than any balance snapshot. Track it every time your pay changes, because a pay rise that does not lift your contribution quietly lowers your rate.
2. Years of current spending covered. Divide your pot by what you spend in a year. This is the multiple that actually means something: at 25 years you are at the conventional full-retirement threshold, and at 5 years you know precisely how far off you are.
3. Your projected shortfall, in monthly income. "I am £180,000 short" is paralysing. "I am about £400 a month short at 65" is a problem with obvious levers: save more, work longer, or spend less in retirement. Same fact, usable form.
4. Your unfunded years. Take the age you would like to stop and the age your projection says you can afford to stop. The gap in years is the cleanest single measure of where you stand, and it responds visibly to every change you make.
Run all four once a year — a birthday is as good a trigger as any — and record them. The trend across three or four years tells you far more than any single comparison against a benchmark built for somebody else's career.
A final word on the emotional half of the question. Retirement saving is one of the few areas where the ordinary, unglamorous action — contribute steadily, raise the rate with each pay rise, do not sell in a bad year — is genuinely most of the answer. Benchmarks are useful right up to the point where they make someone give up, and past that point they do harm. If you are behind, the correct response is a slightly higher contribution rate and a projection you check once a year, not despair. For a personal decision, speak to a regulated adviser; this article is general information only.
Frequently Asked Questions
How much should I have saved for retirement by 30?
The commonly published rule of thumb is about one times your annual salary by 30. It assumes you began contributing in your early-to-mid twenties with an employer match. Most 30-year-olds are below it, particularly anyone who studied late, started on a low salary or has been saving for a house deposit. At this age the contribution rate you establish matters far more than the balance, because there are still 35 or more years for compounding to do the heavy lifting.
Is 3x my salary really enough by age 40?
It is enough to be roughly on track for the assumptions the benchmark was built on — a conventional retirement age, a state or public pension covering part of your spending, and continued contributions with investment growth for another 25 years. It is not a finishing line. If you plan to retire early, expect to spend close to your current income, or have no workplace pension, 3x at 40 leaves you short and the only way to know by how much is to project your own numbers with the retirement calculator.
I am 50 with almost nothing saved. Is it too late?
No, but the levers change. With 15 or so working years left, contributions matter more than compounding, so raising your contribution rate is the strongest single move — many pension systems allow larger contributions from your fifties, so check what your own country permits. Working two or three years longer is unusually powerful because it adds contributions and growth while removing drawdown years. Reducing planned retirement spending also cuts the target pot by roughly 25 times the annual reduction.
Should the multiple be based on salary or on what I spend?
Spending, every time. You will fund a lifestyle in retirement, not a payslip. Salary multiples use pay because it is the number people know, but they mislead in both directions: a heavy saver on a high salary needs far less than 10x, while someone who spends their whole income needs more. Build the target from your annual outgoings, adjust for what stops (commuting, pension contributions, possibly a mortgage) and what rises (health, heating, leisure).
Does a state pension count towards these multiples?
Not usually — the published multiples generally describe your private or workplace savings, on the assumption that a state or public pension covers part of your spending on top. That makes them country-specific in a way the headline number never admits. Check what you are actually forecast to receive: GOV.UK for the UK State Pension, or the Social Security Administration in the US, and subtract that income from your target before sizing the pot.
What return should I assume when projecting my retirement pot?
There is no correct figure, and anyone stating one confidently is guessing. A sensible approach is to run the projection more than once — a cautious assumption, a central one, and a stress case — and judge how fragile the plan is by how far apart the results land. Returns are not guaranteed and past performance does not predict future results, so treat any projection as arithmetic on assumptions rather than a forecast. Investor.gov is a good starting point on how returns and fees interact.
Sources and references
GOV.UK's State Pension guidance (gov.uk) · Social Security Administration (ssa.gov) · Investor.gov (investor.gov). Content was reviewed against these sources as of the last-updated date above; external figures and rules may change after publication.