
The short answer
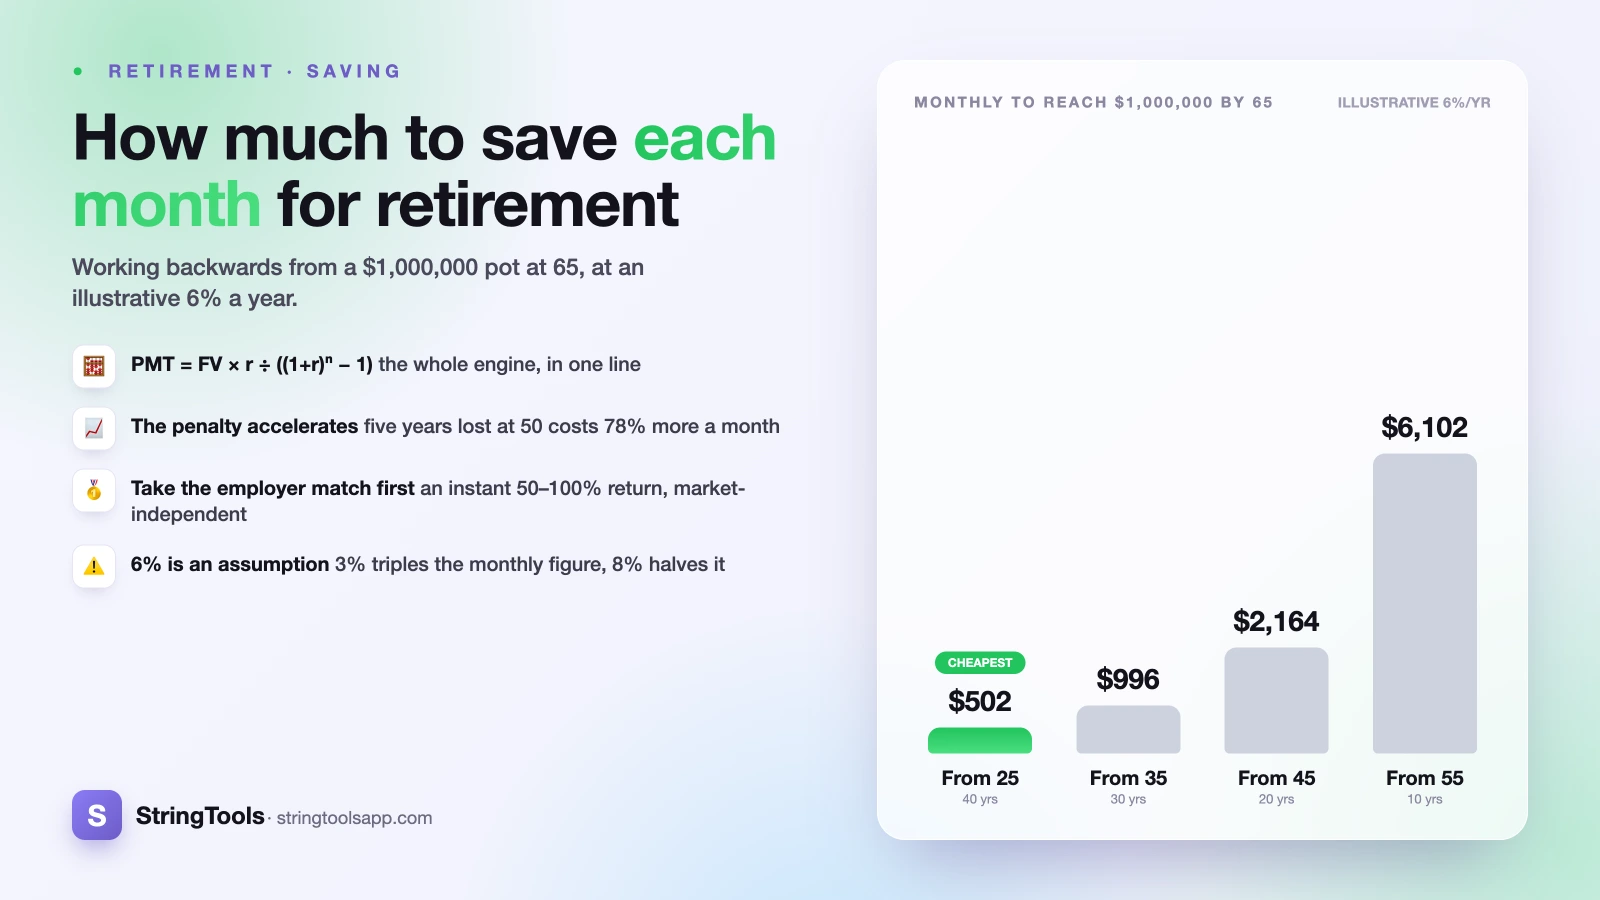
To reach a $1,000,000 pot by 65 at an illustrative 6% a year, you would need to save about $502 a month starting at 25, $996 starting at 35, and $2,164 starting at 45. Work backwards from your own target with the future value of an annuity formula.
Key Takeaways
- The monthly number falls out of four inputs: your target pot, your years of saving, an assumed return, and what you already have.
- Every five years you delay, the required monthly contribution rises by more than the last five years cost you. The penalty accelerates.
- An employer match is the highest-return money most people are ever offered, because the gain is immediate and does not depend on markets.
- Percentage-of-income rules of thumb are a decent starting point in your twenties and a poor one in your fifties.
- Investment returns are not guaranteed and past performance does not predict future results. Every figure here is illustrative arithmetic, not a forecast.
- This is general information, not financial advice. A regulated adviser is the right person for a decision about your own money.
The figures below are in dollars because a round million makes the arithmetic easy to follow, but the maths is currency agnostic. Read them as pounds or euros and nothing changes except the symbol.
Working backwards from a pot to a monthly payment
Most retirement writing answers the wrong question first. It tells you how big a pot you need, which is interesting but not actionable, then leaves you to guess what that means for next month's pay packet. If you have not settled on a target, how much do I need to retire and the 4% rule are the places to start. This post assumes you have a number and want to know what it costs.
A stream of equal monthly contributions that earns a return is a future value of an annuity. The standard formula is:
FV = PMT x (((1 + r)^n - 1) / r)
where PMT is the monthly contribution, r is the monthly return (the annual rate divided by 12), and n is the number of monthly payments. Rearranged to give you the contribution instead of the pot:
PMT = FV x r / ((1 + r)^n - 1)
That is the whole engine. A worked example: you want $1,000,000, you are 35, you stop at 65, and you assume 6% a year to keep it simple. Then r is 0.06 / 12 = 0.005, n is 30 x 12 = 360, and:
(1.005)^360= 6.0226- subtract 1, giving 5.0226
1,000,000 x 0.005 / 5.0226= $995.51 a month
Six percent is a plausible long-run nominal figure for a diversified portfolio, but it is an assumption and nothing more. Returns arrive lumpy, in a different order every time, and the sequence matters as much as the average. The SEC's investor education site is a good, unsold place to read about why. The retirement calculator does this arithmetic for you, including any balance you already hold, which the formula ignores.
What the same $1,000,000 costs at each starting age
This is the table worth screenshotting. Every row targets the same $1,000,000 at 65, at the same illustrative 6% a year, starting from zero.
| Age you start | Years of saving | Monthly amount needed | Total you contribute | Growth's share of the pot |
|---|---|---|---|---|
| 25 | 40 | $502 | $241,025 | 76% |
| 30 | 35 | $702 | $294,797 | 71% |
| 35 | 30 | $996 | $358,382 | 64% |
| 40 | 25 | $1,443 | $432,904 | 57% |
| 45 | 20 | $2,164 | $519,435 | 48% |
| 50 | 15 | $3,439 | $618,942 | 38% |
| 55 | 10 | $6,102 | $732,246 | 27% |
Read the last two columns together, because that is where the story is. The 25 year old contributes $241,025 of their own money and lets growth supply the other three quarters. The 55 year old contributes $732,246, three times as much cash, and growth supplies only a quarter. Starting early does not just reduce the monthly payment. It changes who is doing the work.
The same point differently: $500 a month from 25 to 65 and $1,000 a month from 45 to 65 both cost you $240,000 out of pocket. At 6%, the first ends at roughly $996,000 and the second at roughly $462,000.
Why the cost of waiting accelerates
People expect the penalty for delay to be steady. It is not. Here is what each additional five year wait adds to the required monthly contribution, using the same target and return as the table above.
| Delay | Rise in the monthly amount needed |
|---|---|
| 25 to 30 | +40% |
| 30 to 35 | +42% |
| 35 to 40 | +45% |
| 40 to 45 | +50% |
| 45 to 50 | +59% |
| 50 to 55 | +78% |
Five years given away in your twenties costs 40% more per month. The same five years in your early fifties costs 78%. The reason is structural: growth compounds on the money's remaining time, so the years you lose at the start are the ones that were going to do the most compounding.
The clearest illustration is a saver who does ten years and stops. Put $300 a month away from 25 to 35, contribute $36,000, then never add another penny, and at 6% you arrive at 65 with about $296,000. A saver who starts at 35 and pays $300 every month until 65 contributes $108,000, three times as much, and arrives with about $301,000. Ten early years bought almost the same outcome as thirty late ones. Compound interest explained covers the mechanism, and the compound interest calculator will let you push the numbers around yourself.
Your return assumption moves the answer as much as your start date
It is easy to treat the assumed return as a detail and the start date as the story. The arithmetic disagrees. Here is the monthly contribution needed for the same $1,000,000, starting at 30 with 35 years to run, across a range of illustrative annual returns.
| Assumed annual return | Monthly amount needed |
|---|---|
| 3% | $1,349 |
| 4% | $1,094 |
| 5% | $880 |
| 6% | $702 |
| 7% | $555 |
| 8% | $436 |
The gap between the 3% row and the 8% row is a factor of three, roughly the same spread as starting at 30 versus starting at 45. The number your calculator hands back is only ever as sound as the rate you fed it, and a plan built on 8% is a plan that has quietly assumed a lot.
So run your numbers at a rate you would be comfortable being wrong about, then check one or two points lower. If the plan only works at the top of the range, it is not a plan. And be consistent about nominal versus real: if you want the answer in today's spending power, use a return net of inflation and set the target in today's money too. Mixing a nominal return with a real target is the commonest error in home built retirement spreadsheets.
Fees come out of the same place. A percentage point of annual charges is a percentage point off your assumed return, which the table shows is no rounding error.
The employer match is the highest-return money on offer
If your workplace pension or retirement plan comes with an employer match, that is where the first dollar goes. Not because matched money is magic, but because it is the only part of retirement saving with a guaranteed, immediate, market independent return.
The mechanism is roughly the same everywhere it exists. You contribute some percentage of your pay, and your employer adds money on top, usually either dollar for dollar or at a partial rate such as fifty cents per dollar, up to a ceiling expressed as a percentage of salary. The moment your contribution lands, the match lands with it.
A partial match at fifty cents on the dollar is a 50% instant return on the money you put in. A full match is 100%, and no market has to cooperate for you to receive it. Contributing below the match ceiling is the most expensive small decision most employees make.
What that is worth, at the illustrative 6%: someone on $70,000 contributing 6% of pay puts in $350 a month and reaches about $499,000 over 35 years. With a fifty cents on the dollar match the monthly total becomes $525 and the outcome about $748,000, and the extra $249,000 came from money that was never in their pay packet.
Three things to check in your own scheme:
- The ceiling. Contributing above it is still worth doing, but it is no longer matched.
- Vesting. Some employers only let you keep matched money after a period of service.
- Per pay period or annual. If the match is calculated per period, front loading contributions into the early months can cause you to miss matches later in the year.
Contribution and tax limits differ by country and change regularly, so check your own authority rather than a blog. In the United Kingdom, MoneyHelper is the government backed starting point.
Percentage-of-income rules, and where they break
The most widely cited rule of thumb is to put roughly 15% of gross income towards retirement, counting any employer contribution towards the total, from your mid twenties onwards. It is a reasonable default for one reason: it scales automatically with pay rises, which a flat monthly figure does not.
Here is what the common percentages produce on a $70,000 salary at the illustrative 6%, saving from 30 to 65, with the salary held flat to keep the comparison clean.
| Share of gross pay | Monthly amount | Pot at 65 |
|---|---|---|
| 10% | $583 | $831,000 |
| 15% | $875 | $1,247,000 |
| 20% | $1,167 | $1,662,000 |
The rule breaks at both ends. If you start at 45, no sensible percentage of a normal income closes a thirty five year gap in twenty years, and the rule will reassure you when it should not. If you earn well and spend modestly, it anchors you low.
It also answers the wrong question, telling you what is conventional rather than what your target needs. Better to pick a target, run the formula for your remaining years, get a monthly number, then express that as a share of your pay and see whether it is realistic. Retirement savings by age is the useful sanity check alongside it.
When the number comes back impossible
It often does, particularly for anyone running this for the first time in their forties. The monthly figure is not a verdict. It is one output of five inputs, and four of them can move.
- Add years at the end. Working to 67 rather than 65 does two things at once: two more years of contributions, and two fewer years the pot has to fund.
- Lower the target. The pot follows from the income you want, and that is a choice. A paid off home, a lower cost location, or part time work in the first years of retirement all cut the target directly.
- Escalate rather than start big. Routing each pay rise into the plan before you feel it is far more survivable than a large flat figure you abandon in month four.
- Take the match first. If you are not yet at the match ceiling, that is the cheapest ground you will ever gain.
- Cut the drag. Fees and unnecessary tax come straight off the assumed return.
What does not work is raising the assumed return until the spreadsheet cooperates. That changes your expectations, not your retirement. The Consumer Financial Protection Bureau publishes plain language material on retirement decisions that is worth reading before you make a large one.
A ten minute review, once a year
A retirement number is not a thing you calculate once. It drifts, because your salary, your target and your actual returns all drift. Put a reminder in the same week each year and do four things.
1. Update the balance. Enter what you actually have, not what the plan said you would have. The gap between the two is the only feedback the system gives you. 2. Rerun the contribution. With a real balance and fewer years remaining, the required monthly figure changes. 3. Recheck the match ceiling. Salary changes and scheme changes both move it, and neither will send you a letter. 4. Raise the contribution by whatever your pay rose by. This keeps the percentage constant without ever asking you to accept a cut in take home pay.
If you do only one of those, do the fourth. A saver who holds a constant percentage through a career of pay rises usually ends up far ahead of one who set a good flat figure at 30 and never touched it again. The flat figure quietly shrinks against every raise; the percentage does not.
One last time: every number here is arithmetic on an assumption, not a prediction. Returns are not guaranteed, past performance does not predict future results, and none of this is financial advice. It is a way of turning a vague worry into a specific figure you can argue with.
Frequently Asked Questions
How much should I save each month for retirement?
It depends on your target pot and how long you have. Working backwards to a $1,000,000 pot at 65 at an illustrative 6% a year, you would need about $502 a month from age 25, $996 from 35, $2,164 from 45 and $6,102 from 55. Run your own target and years through the retirement calculator rather than adopting someone else's figure, because the same monthly amount produces wildly different outcomes depending on when it starts.
Is saving 15% of my income enough for retirement?
It is a sound default if you start in your twenties and keep it up, and it has the useful property of scaling with pay rises. It is not enough on its own if you start late. Fifteen percent tells you what is conventional, not what your target requires. The honest test is to run the annuity formula for your own target and remaining years, get a monthly figure, and then check what percentage of your gross pay that actually is.
What if I am 45 and have not started saving for retirement?
The arithmetic is harder but not hopeless, and panic is the expensive response. Four levers still work: contribute to the employer match ceiling first, plan to work a few years longer (which both adds contributions and shortens the drawdown), reduce the target by lowering planned retirement spending or clearing a mortgage, and escalate your contribution with every pay rise. Many countries also allow larger contributions in the years close to retirement. Check your own scheme rules for what applies to you.
Should I contribute enough to get the full employer match before anything else?
For most people, yes, once high interest debt is under control and a basic emergency fund exists. A fifty cents on the dollar match is an immediate 50% return on the matched portion, and a full match is 100%, neither of which depends on markets behaving. Check your scheme's vesting rules first, since matched money you have not yet vested in is not yet yours.
What annual return should I assume when planning retirement contributions?
Use a figure you would be comfortable being wrong about, then test the plan one or two percentage points lower. The difference is not academic: for a 35 year horizon, the monthly amount needed to reach $1,000,000 ranges from $436 at 8% to $1,349 at 3%. Be consistent about nominal versus real. If you want the answer in today's spending power, use a return net of inflation and set your target in today's money too.
Is it better to save monthly or invest a lump sum once a year?
Monthly is usually better in practice, for behavioural rather than mathematical reasons. It gets the money invested sooner, it is harder to spend money that leaves your account automatically, and it removes the annual decision about whether now is a good moment. The formula above assumes month end contributions, so if you contribute at the start of each month your result will be slightly higher than the table shows.
Sources and references
SEC's investor education site (investor.gov) · MoneyHelper (moneyhelper.org.uk) · Consumer Financial Protection Bureau (consumerfinance.gov). Content was reviewed against these sources as of the last-updated date above; external figures and rules may change after publication.