
Nominal is the headline. Real is the outcome
A nominal return is the headline percentage a bank, fund or forecast quotes. A real return is what is left after inflation, and it is the one that decides whether your money buys more than it did before. Convert between them with the exact relationship (1 + nominal) / (1 + inflation) - 1.
Key Takeaways
- Nominal answers "how many more pounds or dollars do I have?" Real answers "can I buy more than before?" Only the second question matters.
- The exact conversion is
real = (1 + nominal) / (1 + inflation) - 1. The familiar shortcut,nominal - inflation, is an approximation. - The shortcut is out by exactly the inflation rate in relative terms. When the return beats inflation it reads too high; when inflation wins, it reads too low and exaggerates the loss.
- Over a few years that gap is trivial. Over thirty or forty years it compounds into real money.
- The costliest mistake is not the approximation. It is comparing a nominal return against a target set in today's money.
- Tax is charged on the nominal gain, which is why a positive nominal return can still be a real loss.
Most of the numbers quoted in financial life are nominal: the rate on a savings account, the yield on a bond, the long-run average someone cites for a stock market, the pay rise in your letter. They are all counts of currency, and none of them tells you on its own whether you are better off.
That is because currency is a ruler that shrinks. If your account pays 3% and prices rise 3%, your balance grows and your standard of living does not move at all. This post is general information, not financial advice.
The exact formula, and the shortcut everyone uses
The real return asks how much your money grows relative to how much prices grow. Both are growth factors, so you divide one by the other:
1 + real = (1 + nominal) / (1 + inflation)
Rearranged, that is the form you will actually type:
real = (1 + nominal) / (1 + inflation) - 1
This is the Fisher relationship, named after the economist Irving Fisher, and it is exact. Investopedia sets out the same identity under the heading of the real rate of return.
A worked example
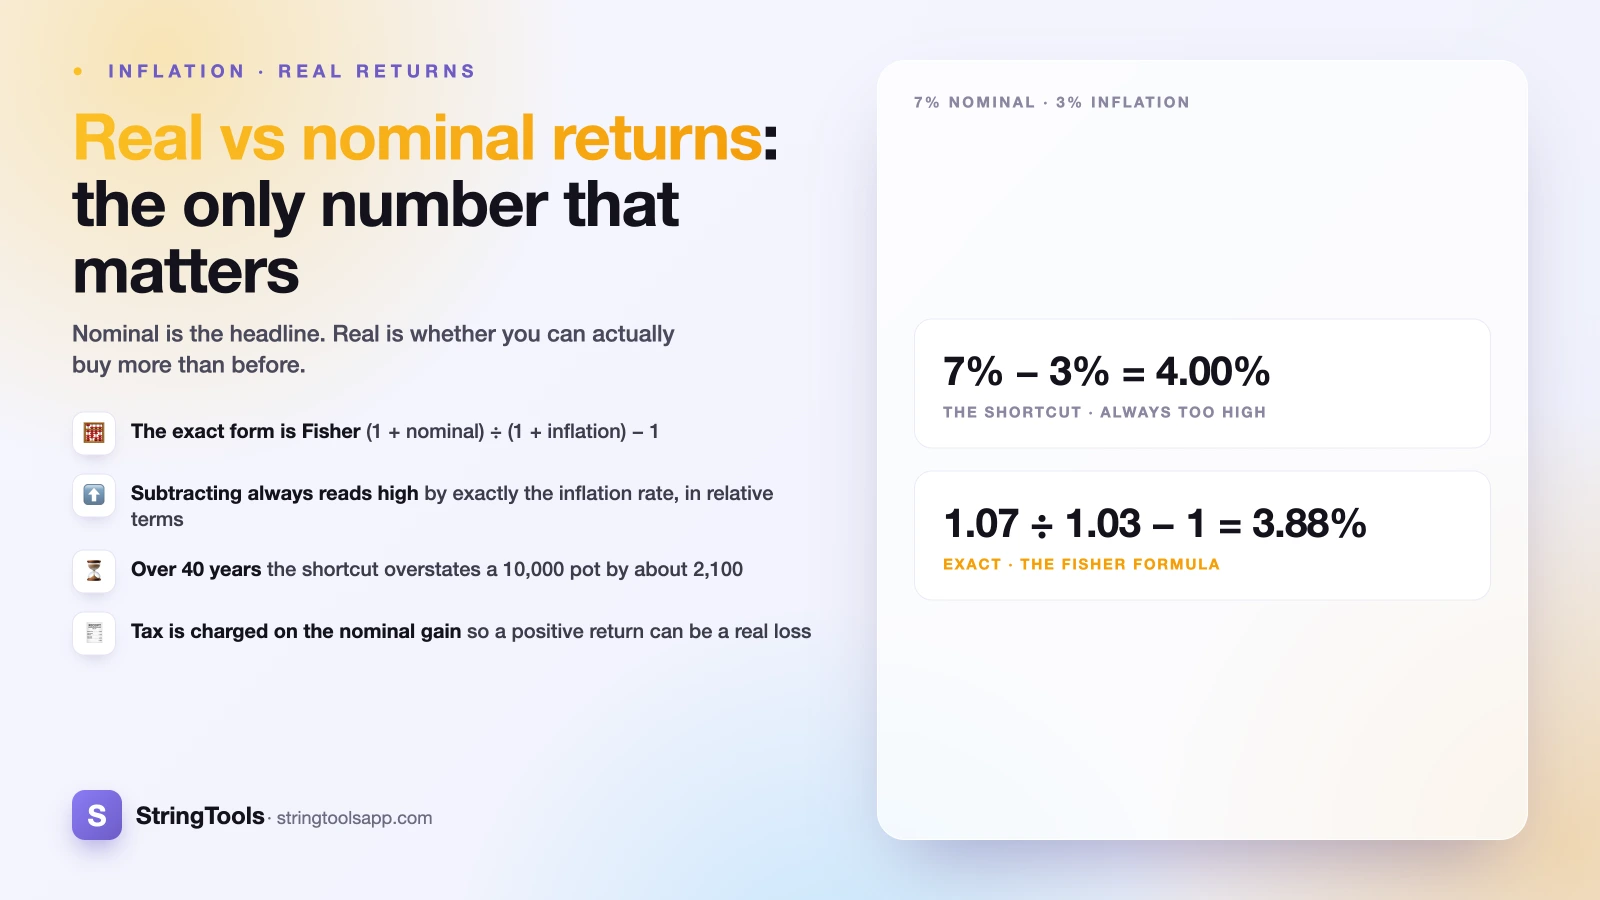
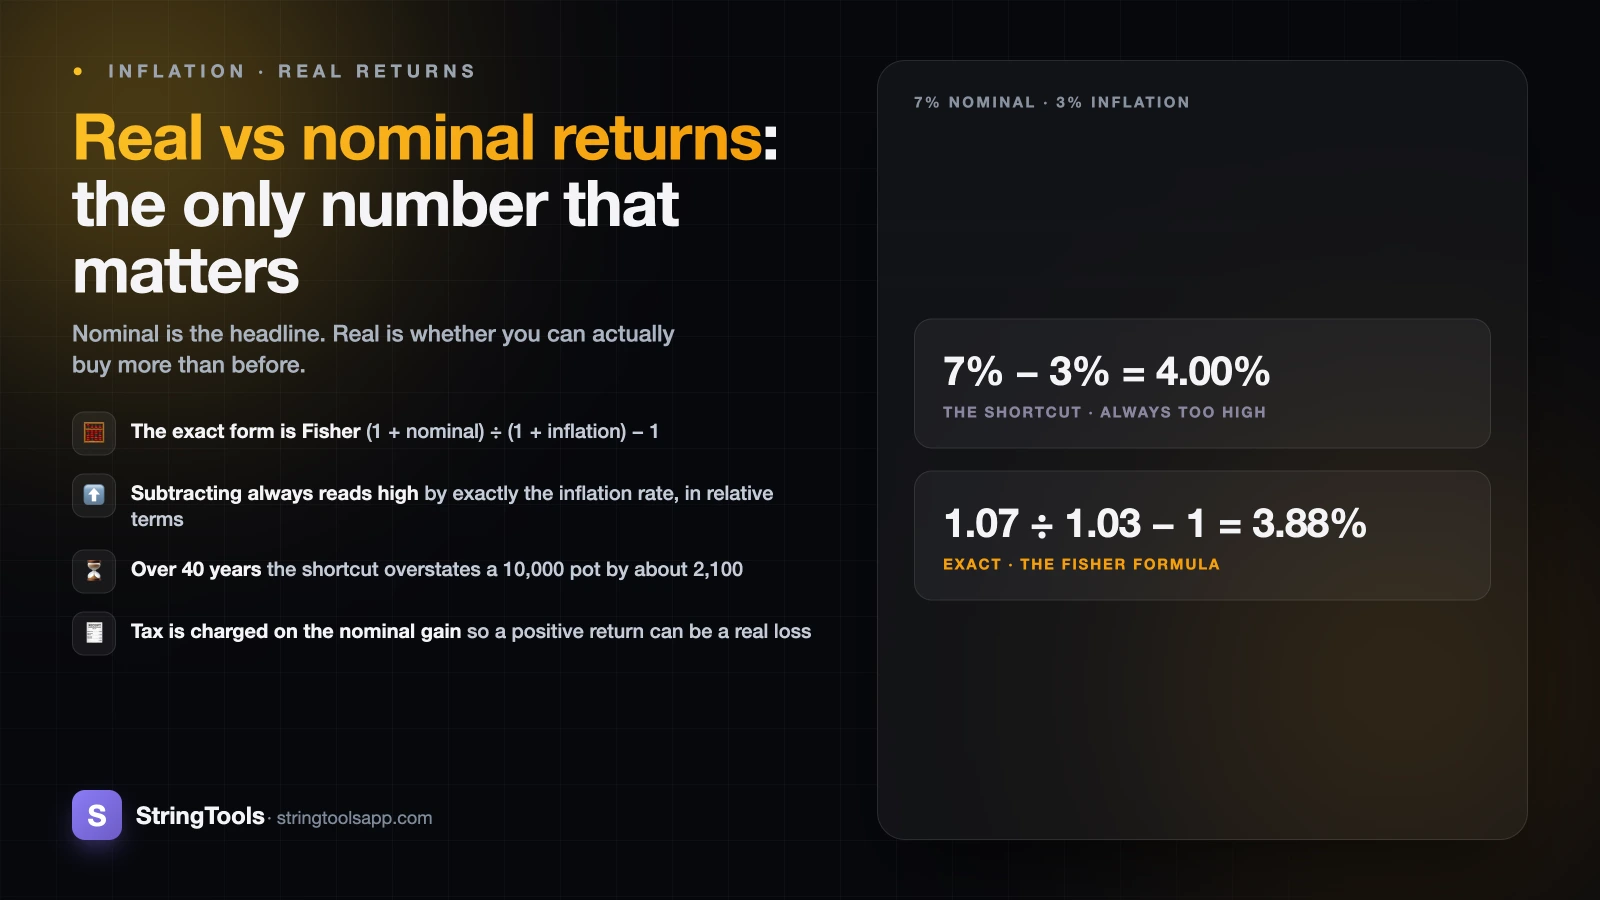
Suppose an investment returns 7% over a year while prices rise 3%.
- Growth factor of your money: 1.07
- Growth factor of prices: 1.03
- Ratio: 1.07 / 1.03 = 1.038835
- Real return: 3.8835%, or about 3.88%
The shortcut everyone reaches for is 7% - 3% = 4%. For a back-of-an-envelope check that is fine, but it is not the answer, and the error always runs the same way.
Why the shortcut is wrong in a predictable way
Work the exact formula through algebraically and it simplifies to something revealing:
real = (nominal - inflation) / (1 + inflation)
The numerator is the shortcut. The denominator is always greater than one when inflation is positive. So the shortcut is the exact answer multiplied by (1 + inflation), which puts it out by exactly the inflation rate as a proportion. When the real return is positive — the usual case — that makes subtraction too high: at 3% inflation it overstates by 3% of itself, at 10% inflation by 10% of itself. When inflation exceeds the nominal return, the same multiplication runs the other way and the subtraction figure comes out more negative than the truth. The proportion never changes; the direction does.
Where the approximation drifts: the reference table
The gap between the two methods is driven almost entirely by the inflation rate. Every row below is calculated from the same two formulas: approximate is nominal - inflation, exact is (1 + nominal) / (1 + inflation) - 1. The final column is the difference in percentage points.
| Nominal | Inflation | Approx (subtract) | Exact (Fisher) | Gap (approx - exact) |
|---|---|---|---|---|
| 3% | 2% | 1.00% | 0.98% | 0.02 pp |
| 5% | 2% | 3.00% | 2.94% | 0.06 pp |
| 5% | 3% | 2.00% | 1.94% | 0.06 pp |
| 6% | 2% | 4.00% | 3.92% | 0.08 pp |
| 7% | 3% | 4.00% | 3.88% | 0.12 pp |
| 8% | 4% | 4.00% | 3.85% | 0.15 pp |
| 10% | 3% | 7.00% | 6.80% | 0.20 pp |
| 10% | 5% | 5.00% | 4.76% | 0.24 pp |
| 12% | 6% | 6.00% | 5.66% | 0.34 pp |
| 15% | 10% | 5.00% | 4.55% | 0.45 pp |
| 20% | 10% | 10.00% | 9.09% | 0.91 pp |
| 2% | 5% | -3.00% | -2.86% | -0.14 pp |
| 3% | 6% | -3.00% | -2.83% | -0.17 pp |
All figures are illustrative and rounded to two decimal places. They are arithmetic, not forecasts.
Three things are worth reading out of that table.
- At low inflation the shortcut is harmless. At 2% inflation the error is a rounding artefact. Nobody makes a worse decision by saying 3% instead of 2.94%.
- The error is the product of two things, not one. The gap works out as
(nominal - inflation) x inflation / (1 + inflation), so it widens both as inflation climbs and as the real return itself gets bigger. Compare 3%/2% (0.02 pp) with 6%/2% (0.08 pp) at identical inflation, then with 10%/5% (0.24 pp). - When inflation exceeds the nominal return, the shortcut exaggerates the loss. At 2% nominal against 5% inflation, subtraction says you lost 3% of purchasing power. You actually lost 2.86%.
Why decades punish the error and years do not
A tenth of a percentage point sounds like nothing, and for one year it is. The trouble is that returns compound, so a small error in the rate becomes a growing error in the balance.
Take the 7% nominal / 3% inflation case from the table. Start with 10,000 units of currency and leave it alone. The nominal balance is what your statement would say; the real balance is that same money in today's purchasing power; the last column is what the 4% shortcut would have predicted.
| Horizon | Nominal balance at 7% | True real value (3.88% real) | Predicted by the 4% shortcut | Overstatement |
|---|---|---|---|---|
| 10 years | 19,672 | 14,637 | 14,802 | 165 |
| 20 years | 38,697 | 21,426 | 21,911 | 486 |
| 30 years | 76,123 | 31,361 | 32,434 | 1,072 |
| 40 years | 149,745 | 45,905 | 48,010 | 2,105 |
Illustrative only. A fixed 7% every year for forty years is not something any investment offers; returns are not guaranteed and past performance does not predict future results. The point is the arithmetic, not a forecast.
Two lessons sit in that table. First, the shortcut's error reaches about 2,100 units of currency on a 10,000 starting balance over forty years — small next to the total, but real, and it grows with the horizon. Second, and far more important: the nominal column is a fantasy. A balance of 149,745 after forty years of 3% inflation buys what 45,905 buys today.
The second effect dwarfs the first. Getting Fisher exactly right matters at the margins; inflation-adjusting at all is the difference between a plan and a daydream. How to calculate purchasing power works through the deflator on its own.
The trap: a nominal return against a real target
The mistake that costs people most is not sloppy arithmetic. It is mixing the two units in one calculation without noticing.
It usually looks like this. Someone decides they need a certain income in retirement, and pictures that income in today's money, because today's money is the only money anyone has a feel for. Then they project their savings forward using a long-run nominal average return. Nominal growth, real target. The projection clears the goal by a mile, and the goal has quietly moved with every year of inflation in between.
At 3% inflation the purchasing power of a fixed sum halves in a little over 23 years. At 2% it takes about 35 years; at 5%, about 14. A target set in today's money and funded with a nominal projection can therefore be out by a factor of two over a working life.
How to keep the units straight
There are two consistent ways to run a long-horizon projection, and mixing them is what breaks:
- Work entirely in real terms. Use a real growth rate, state the target in today's money, and raise your contributions with inflation each year. Everything on the page is in today's purchasing power.
- Work entirely in nominal terms. Use a nominal growth rate, then inflate the target by the same assumption over the same number of years before comparing.
The first is easier to reason about, which is why careful projections tend to be quoted "in today's money". If a projection does not say which convention it uses, that is the first question to ask; the SEC's Investor.gov is a reasonable starting point on how projections and fees should be presented.
The same trap appears in smaller places. A 4% pay rise in a year when prices rose 5% is a pay cut. A house that "doubled in twenty-five years" under steady 3% inflation has roughly kept pace and no more. And what inflation does to your savings is this arithmetic applied to a cash balance that is not growing at all.
Tax, fees and the order you subtract things
There is a third layer that quietly makes real returns worse than the two-variable formula suggests, and the order of operations matters.
Tax is generally charged on the nominal gain. Tax authorities count currency, not purchasing power, so you can be taxed on a gain that never existed in real terms. Fees work the same way: they are a share of the nominal balance. The correct sequence is to start with the nominal return, subtract fees, apply tax, and only then deflate by inflation.
A worked example
Assume 5% nominal interest, a 20% tax rate on that interest, and 3% inflation. All three are illustrative, chosen to keep the sums clean.
- Nominal return: 5%
- After 20% tax: 5% x 0.80 = 4%
- Real, after tax:
1.04 / 1.03 - 1= 0.97%
Ignore the tax and you would have said 1.94%. Include it and the real return is roughly half that: a rate that looked like it comfortably beat inflation beats it by less than a percentage point.
The break-even moves too. With a 20% tax rate and 3% inflation you need about 3.75% nominal just to stand still, because 3.75% x 0.80 = 3%. Below that you are losing real money while the statement balance rises. Tax rules, rates, allowances and which accounts are sheltered differ by country and change over time, so check your own tax authority rather than assuming any rate here applies to you.
Which inflation number should you even use?
The formula needs an inflation rate, and there is no single correct one — only a set of published measures, each answering a slightly different question, plus your own personal rate, which nobody publishes.
National statistics agencies build a consumer price index from a representative basket of goods and services and reweight it periodically. In the United States that is the Bureau of Labor Statistics at bls.gov; in the United Kingdom, the Office for National Statistics at ons.gov.uk. Both publish long historical series, which is what makes any "real return since year X" claim checkable.
Three caveats are worth carrying:
- Your basket is not the basket. If a large share of your spending goes on rent, childcare or energy, your lived inflation rate can diverge from the headline for years.
- Indices are backward-looking. Using last year's rate as next year's assumption is a convenience, not a forecast.
- Different measures give different answers. Countries publish several variants, and real returns calculated against different ones are not directly comparable. Say which you used.
So precision beyond one decimal place in a long-run real return is false comfort. Getting the method right matters; pretending to know future inflation to two decimals does not.
Running the numbers on your own figures
A four-step check for any return you are quoted
1. Ask whether the number is nominal or real. Assume nominal unless it says otherwise. "In today's money" and "inflation-adjusted" mean real; everything else is nominal.
2. Deduct fees and tax first, while you are still in nominal terms, since both are charged on nominal amounts.
3. Deflate with the exact formula: (1 + nominal) / (1 + inflation) - 1. Use the shortcut only as a sanity check, and remember it reads high whenever the return beats inflation.
4. Compound the real rate, not the nominal one, over your actual horizon. That is where the difference stops being academic.
The inflation calculator handles the deflator side — what a sum from one year is worth in another year's money — and the compound interest calculator handles the growth side. Feed the real rate into the second and the answer comes out in today's purchasing power, which is the only unit you can plan in. For the retirement version, how much do I need to retire covers setting the target itself.
The one-line version
A return you cannot compare to inflation is not information. Two accounts paying 4% are not the same account if one sits in a country with 2% inflation and the other 6%: one grows your purchasing power by roughly 1.96% a year, the other shrinks it by roughly 1.89%. Identical headline, opposite outcomes.
This article is general information, not financial advice. Nothing here recommends any product, provider or investment, returns are never guaranteed, and a regulated adviser is the right person to speak to about a decision that affects your own money.
Frequently Asked Questions
What is the formula for real return?
The exact formula is real = (1 + nominal) / (1 + inflation) - 1, with both rates as decimals. For a 7% return and 3% inflation: 1.07 / 1.03 - 1 = 0.038835, or 3.88%. The common shortcut, nominal - inflation, gives 4% here. It is close but always slightly high.
Why can't I just subtract inflation from my return?
You can, for a rough check. The exact formula simplifies to (nominal - inflation) / (1 + inflation), so subtraction is the true answer multiplied by (1 + inflation). It is therefore out by exactly the inflation rate in relative terms: 3% away from the truth at 3% inflation, 10% away at 10%. Where the return beats inflation that error reads high; where inflation wins, it reads low and overstates the loss. Below roughly 3% inflation the drift is a rounding artefact. In a high-inflation period it is not.
Can a real return be negative while the nominal return is positive?
Yes, and it is common. Any time inflation runs above your nominal return, your balance rises while your purchasing power falls. A 2% savings rate during 5% inflation is a real return of about -2.86% a year. Add tax on the interest and the real loss is larger still, because tax is charged on the nominal amount.
Should I use a real or nominal rate for a retirement projection?
Either, as long as you are consistent. Work in real terms and your target stays in today's money, but your contributions should rise with inflation each year. Work in nominal terms and you must inflate the target by the same assumption over the same horizon before comparing. Mixing a nominal growth rate with a target set in today's money is the single most common error, and over a working life it can be wrong by a factor of two.
Does tax come off before or after the inflation adjustment?
Before. Tax and fees are charged on nominal amounts, so subtract them while you are still working in nominal terms, then deflate. With 5% nominal interest, 20% tax and 3% inflation: 5% becomes 4% after tax, and 1.04 / 1.03 - 1 gives a real return of 0.97%. Tax rules and rates differ by country and change over time, so check your own tax authority.
Which inflation rate should I use in the calculation?
For a general figure, use the headline consumer price index from your national statistics agency, such as the US Bureau of Labor Statistics or the UK Office for National Statistics. Say which measure you used, since countries publish several variants that give different answers. Bear in mind your personal inflation rate depends on your own spending, and can differ from the headline for years at a time.
Sources and references
Investopedia (investopedia.com) · SEC's Investor.gov (investor.gov) · bls.gov (bls.gov) · ons.gov.uk (ons.gov.uk). Content was reviewed against these sources as of the last-updated date above; external figures and rules may change after publication.