
The honest answer: it depends on how long you stay
Neither is universally cheaper. Renting is cheaper over short stays, because buying carries large one-off transaction costs that take years to earn back. Buying tends to win over long stays, because rent keeps rising while a fixed mortgage payment does not, and part of that payment builds equity rather than disappearing.
Key Takeaways
- Comparing your rent to a mortgage payment is the wrong comparison. Part of that payment is principal, which is saving, not spending.
- The real question is a break-even horizon: how many years you must stay before buying overtakes renting.
- Transaction costs create that horizon. A round trip of buying and selling commonly costs somewhere between 5% and 15% of the price depending on the jurisdiction, with many markets near 8% to 10%, whether prices rise or fall.
- The deposit is not free. Money locked in a house is money not compounding elsewhere, and that opportunity cost belongs in the sum.
- The break-even year is unstable. Small changes to house-price growth, rent, the mortgage rate or maintenance can move it from six years to never.
- This is general information, not financial advice. A regulated adviser is the right person for a decision about your own money.
Everything below uses one illustrative example: a home priced at 400,000 in your currency, a 10% deposit, a 30-year mortgage at 5%, and the same home available to rent at 1,600 a month, with rent and the running costs both assumed to rise 3% a year. Those figures are chosen to be easy to follow, not to predict anything.
Why rent versus the mortgage payment is the wrong comparison
On the illustrative numbers, the mortgage on a 360,000 loan at 5% over 30 years is about 1,933 a month against rent of 1,600. That looks like a gap of roughly 330 a month, which is how most people first frame the decision. The framing is wrong in both directions at once.
It overstates the cost of buying, because a mortgage payment is two different things bolted together. In the first year of this loan, about 17,900 goes to interest and about 5,300 repays principal. The interest is a fee for borrowing and it is gone. The principal is not a cost at all: it moves money from your current account into the house, and you get it back when you sell. Roughly 23% of the first year's payments are saving rather than spending, and that share climbs every year as the balance falls.
It also understates the cost of buying, because the payment is not the whole bill. Maintenance, property tax or local rates, and buildings insurance are all costs a tenant does not carry. On this example they add about 733 a month before anything breaks.
What each option actually costs in a single year
This table sets out year one, with money genuinely spent separated from money that becomes equity. The renter is assumed to invest the 56,000 the buyer hands over as deposit and purchase costs, earning 5% a year. Returns are not guaranteed and past performance does not predict future results; 5% is here to keep the arithmetic legible.
| Year one | Renting | Buying |
|---|---|---|
| Rent at 1,600 a month | 19,200 | 0 |
| Mortgage interest | 0 | 17,900 |
| Maintenance and repairs, at 1% of value | 0 | 4,000 |
| Property tax or local rates, at 1% of value | 0 | 4,000 |
| Buildings insurance | 0 | 800 |
| Return on the 56,000 not tied up in a house | -2,800 | 0 |
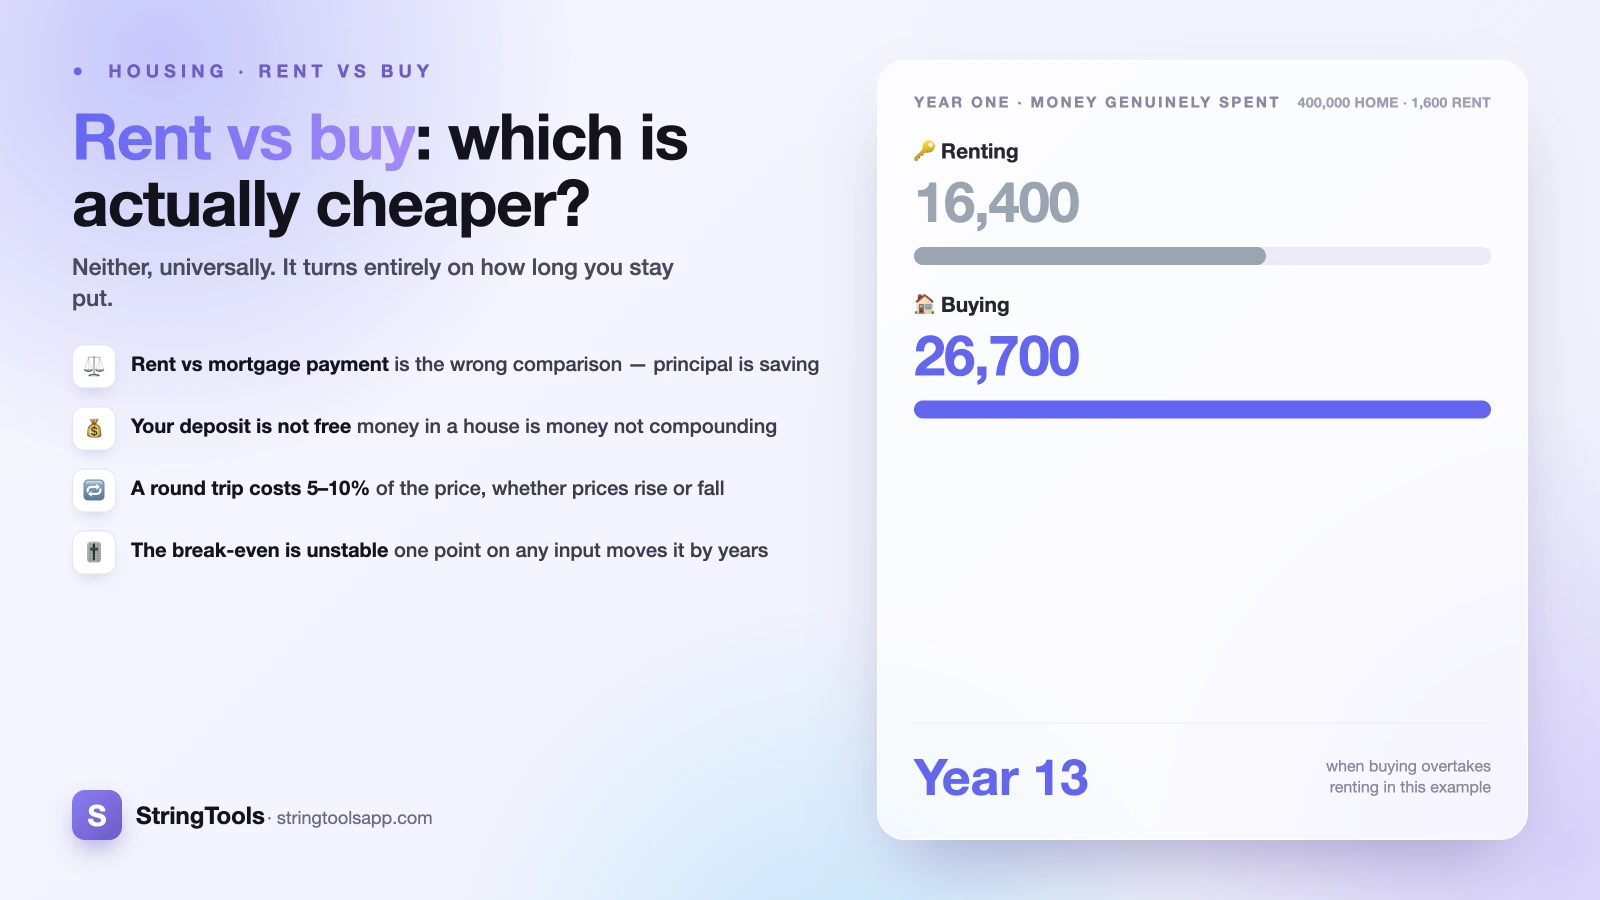
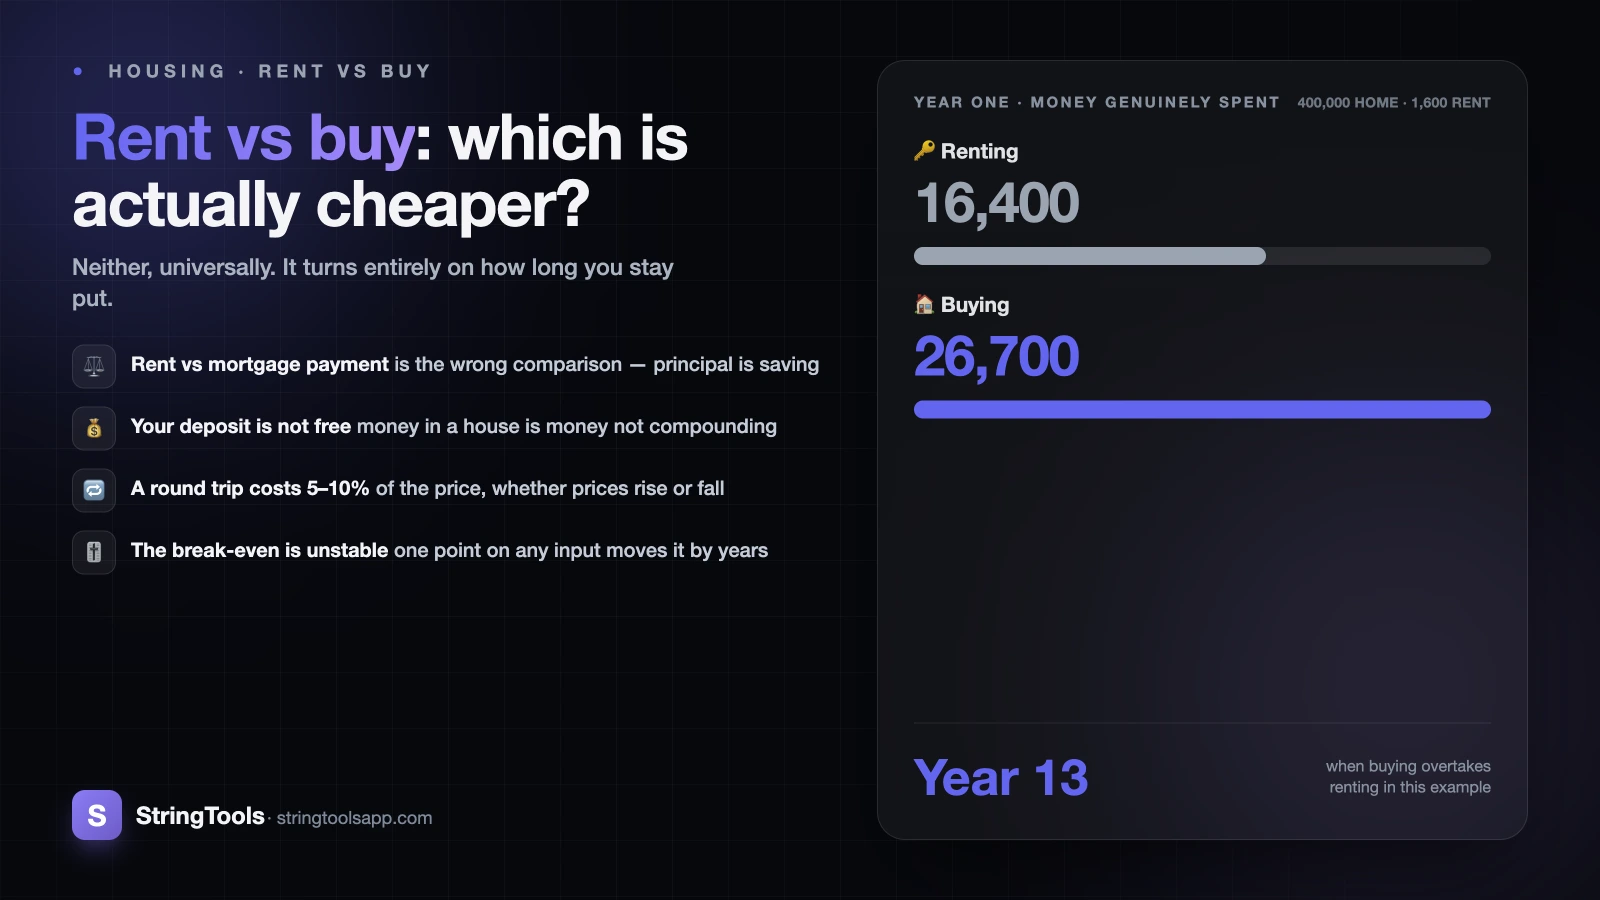
| Money genuinely spent | 16,400 | 26,700 |
| Mortgage principal repaid (equity, not a cost) | 0 | 5,300 |
| Total cash leaving your account | 19,200 | 32,000 |
Two numbers matter. Cash out of the door is about 32,000 against 19,200, a difference of roughly 1,066 a month, which is what your bank balance feels. Money genuinely spent is 26,700 against 16,400, a difference of about 860 a month, which is what the decision turns on. Both are far bigger than the 330 a month the naive comparison suggested.
Buying is rarely cheaper month to month in the early years. What it does is convert part of a larger outflow into an asset, and stop the rent side of the bill from rising. Property tax is the row that travels worst: a large annual cost in much of the United States, much smaller in many other places. The 1% used here is a placeholder, not a rate.
The deposit is not sitting still, it is doing a job somewhere
The row most comparisons omit is the opportunity cost of the deposit. Putting 40,000 down and paying 16,000 in purchase costs means 56,000 is no longer available to do anything else. A renter with the same 56,000 can leave it invested, earning 2,800 in the first year of this example.
That is not a trick to make buying look bad. The same logic makes buying look good later, through leverage: a 10% deposit controls the whole 400,000 house, so a 3% rise adds 12,000 on 40,000 of your own money. Leverage cuts both ways with equal force.
Two consequences follow, and they surprise people.
- When the mortgage rate and the return you would expect on invested savings are close, the size of the deposit barely moves the break-even year. A bigger deposit lowers the payment and the interest, but removes exactly that money from your investments. It changes who your money works for, not how hard it works.
- When you expect a higher return than your mortgage rate, a larger deposit pushes the break-even further out. When you expect less, it pulls it closer.
Nobody can honestly tell you what returns to expect. The SEC's Investor.gov explains how compounding and risk actually behave, and the CFPB's owning a home guides cover the mortgage side without selling you anything.
The break-even horizon, and why it exists at all
The break-even horizon is the year at which a buyer who sold up would walk away with more money than a renter who had invested every penny of the difference. It exists because of transaction costs.
Buying costs money that buys you nothing: some combination of transfer or stamp duty, legal fees, surveys, mortgage arrangement fees and moving costs. Selling costs again, mostly agent commission and legal fees. A round trip commonly lands somewhere between 5% and 15% of the price, with many markets near 8% to 10%. On a 400,000 home at 4% to buy and 3% to sell, you begin roughly 28,000 behind and must claw it back out of equity growth and rent you no longer pay.
That is why short stays lose. Sell after two years and you have paid a five-figure entry fee to live somewhere for 24 months. Sell after twenty and the fee is spread thin, while the payment that felt punishing in year one looks small against a rent that has been rising throughout.
Run the illustrative example year by year and the buyer is about 27,000 behind after one year, 21,000 behind after five, 10,000 behind after ten, and passes the renter in year 13. Year 13 is not a rule, it is the output of one set of assumptions. To run the model on your own rent, price, deposit, rate and assumptions, use the rent vs buy calculator, which reports the year buying overtakes renting for your inputs. How long until buying beats renting goes deeper into the horizon itself.
What actually moves the break-even year
This is the table worth keeping. Each row changes exactly one assumption and leaves everything else alone. "Never" means no break-even inside 40 years.
| Change one thing in the base case | Break-even year |
|---|---|
| Base case: 5% mortgage, 3% house growth, 1,600 rent rising 3% a year, 5% investment return | 13 |
| Mortgage rate 4% instead of 5% | 6 |
| Mortgage rate 6% instead of 5% | Never within 40 years |
| House prices grow 4% a year instead of 3% | 6 |
| House prices grow 2% a year instead of 3% | Never within 40 years |
| Rent is 1,800 a month instead of 1,600 | 7 |
| Rent is 1,400 a month instead of 1,600 | Never within 40 years |
| Buying and selling costs of 6% and 5% instead of 4% and 3% | 21 |
| Maintenance at 0.5% of value instead of 1% | 7 |
| Investments return 7% a year instead of 5% | Never within 40 years |
The lesson is not that buying is bad, or good. It is that a single-point answer to "which is cheaper" is close to meaningless. A one percentage point change in almost any input moves the answer by years, or removes it entirely.
Note which levers are strongest. Rent relative to price does most of the work: 200 a month either way flips this example from seven years to never. House-price growth is second, and nobody can know it. Transaction costs are third, and the one input you can look up in advance.
Note also which lever is weak. The deposit percentage barely appears. If you are agonising over 10% versus 20% purely on cost grounds, this model says it changes very little.
Costs on each side that the spreadsheet keeps forgetting
Both columns have costs that are easy to leave out, and leaving them out is how people talk themselves into a decision.
Owning tends to be understated by:
- Maintenance, because it arrives in lumps. Nothing happens for four years, then a roof costs a large fraction of a year's rent. A percentage per year is a smoothing device, not a forecast.
- Furnishing and improving. Owners spend on their homes in a way tenants do not, and that spending rarely returns its cost at sale.
- Illiquidity. Selling takes months and you cannot sell a bedroom, so moving for work is slow and expensive.
- Buying more house than you would rent. If ownership pushes you from a two-bed to a three-bed, you are no longer comparing like with like.
Renting tends to be understated by:
- Rent that rises for as long as you rent, with no terminal date. A fixed mortgage payment is flat and eventually stops entirely.
- Moving costs at the end of every tenancy, plus deposits, fees and time.
- No control over whether you can stay. A landlord selling up can end your plans at short notice.
- The discipline problem. The renter in every model of this kind invests the difference every month. Real renters frequently do not.
That last point is the strongest honest argument for buying that has nothing to do with returns. A mortgage is forced saving, and it works on people who would not otherwise save. Spreadsheets assume perfect behaviour on both sides; people are not spreadsheets.
The reasons that are not about money at all
There are good non-financial reasons to buy and good non-financial reasons to rent, and neither list is the lesser argument.
People buy for security of tenure, for the freedom to change the building, for schools and roots, for a payment that ends before retirement, and because a home is not only an asset. People rent for mobility, to take a job in another city at short notice, to avoid a repair bill they cannot absorb, to keep savings liquid and diversified rather than concentrated in one street, and because a smaller commitment leaves room for other plans.
If you know you will move within three or four years, the arithmetic says renting almost certainly wins, and the non-financial case has to be very strong to override a five-figure round-trip cost. If you are staying fifteen years, the arithmetic is close to a coin flip in many markets, and the non-financial reasons should decide it.
How to work out your own answer
Do it in this order, and do not skip the first step.
- Find your real rent-to-price ratio. Divide the annual rent for a home you would genuinely be happy in by the price of a comparable home to buy. This ratio drives more of the answer than everything else combined, and differs by a factor of two or more between cities.
- Look up your actual transaction costs. Stamp or transfer duty, legal fees, survey, mortgage fees, and the agent commission you pay on the way out. In the UK, MoneyHelper sets these out; in the US, the CFPB covers closing costs.
- Get an honest maintenance number. For an older building, budget more than 1% of value. For a flat, service charges and ground rent are a separate line.
- Decide how long you intend to stay, then be honest about the odds you are wrong.
- Run the model with your inputs. The rent vs buy calculator takes rent, price, deposit, rate, term and your assumptions for house-price growth, investment return and costs, and reports the break-even year.
- Run it again with worse assumptions. Take a percentage point off house-price growth and add one to the mortgage rate. If buying still wins inside your intended stay, the answer is robust. If it flips, it was a forecast, not a calculation.
Then check the borrowing side, because a break-even year means nothing if the payment is unaffordable. How much house can I afford covers affordability limits, the true cost of buying a home itemises what completion costs, and the mortgage calculator shows the payment and interest split for any price and rate.
Every figure above is illustrative. None of it forecasts house prices, rents, rates or investment returns, none of it is a recommendation, and returns are not guaranteed. This is general information; for a decision about your own money, speak to a regulated financial adviser or mortgage broker in your own country.
Frequently Asked Questions
Is renting really throwing money away?
No, and neither is buying. Rent buys you somewhere to live for a month, which is a service you consumed. The equivalent on the buying side is mortgage interest, maintenance, property tax and insurance, which are also gone. In the illustrative example in this article, the buyer spends about 26,700 in year one on things they never get back, against about 16,400 for the renter. The part of a mortgage payment that is genuinely different is the principal, which is saving rather than spending. That distinction, not the slogan, is what makes the comparison work.
How many years do I need to stay for buying to be cheaper?
There is no universal number, and anyone quoting one is quoting their own assumptions. The illustrative example here breaks even in year 13, but a one percentage point change to the mortgage rate or to house-price growth, or a 200 a month change in rent, moves that to six years or to never. To get a number you can use, run your own rent, price, deposit, rate and costs through the rent vs buy calculator, then run it again with worse assumptions to see whether the answer holds.
Should I compare my rent to the mortgage payment?
Not directly, because they are not the same kind of number. A mortgage payment mixes interest, which is a cost, with principal, which is money moving into an asset you own. It also excludes maintenance, property tax or rates, and buildings insurance, none of which a tenant pays. Compare rent against interest plus running costs, and count principal separately as equity. In this article's example that turns an apparent 330 a month gap into roughly 860 a month of genuinely spent money.
Does a bigger deposit make buying cheaper overall?
It lowers the monthly payment and the total interest, and it often earns a better mortgage rate, which is a real saving. But it also takes that money out of your savings, where it would otherwise be growing. In the model used here, when the mortgage rate and the expected investment return are similar, changing the deposit from 5% to 30% barely moves the break-even year at all. A bigger deposit mainly changes your risk, your payment and the rate you are offered, rather than the underlying rent-versus-buy answer.
What happens to the comparison if house prices fall?
Leverage makes the effect larger than it looks. With a 10% deposit, a 3% fall in prices removes roughly 30% of your equity, and transaction costs sit on top of that. In the sensitivity table above, dropping house-price growth from 3% to 2% a year is enough to remove the break-even entirely inside 40 years. That is the honest risk of buying with a short horizon, and it is why the intended length of stay matters more than any other input. Nobody can tell you what prices will do.
Does the answer change depending on which country I am in?
Substantially. Transaction taxes, agent commissions, property taxes, typical mortgage terms and whether mortgage interest carries any tax relief all differ by country and often by region. Rent-to-price ratios differ even between neighbouring cities. Treat every percentage in this article as a placeholder, replace it with your own local figures before drawing a conclusion, and check the rules with your own tax authority or a regulated adviser rather than a general guide.
Sources and references
SEC's Investor.gov (investor.gov) · CFPB's owning a home guides (consumerfinance.gov) · MoneyHelper (moneyhelper.org.uk). Content was reviewed against these sources as of the last-updated date above; external figures and rules may change after publication.