
The break-even horizon, in one answer
Buying beats renting once ownership has earned back the one-off costs of getting in and out. That is commonly several years, and in markets with high purchase taxes and flat prices it can stretch past a decade or never arrive. The horizon depends on transaction costs, price growth and rent growth.
Key Takeaways
- Buying carries large costs at both ends. The break-even is simply the point at which the benefits of owning have paid those costs back.
- There is no universal number of years. Change the transaction costs or the price growth assumption and the answer moves by a decade.
- The comparison is not rent versus mortgage payment. It is your net wealth as an owner against your net wealth as a renter who invested the deposit.
- High purchase taxes, flat house prices, high mortgage rates and strong investment returns all push the break-even further out.
- Low costs, rising prices and rent rising faster than ownership costs pull it in.
- If you are unsure whether you will stay put, that uncertainty is itself an argument for renting, because selling early is where the losses concentrate.
The question people usually ask is "is it cheaper to buy or to rent?" That has no answer without a time horizon attached, which is why it ends in a stalemate so often. Add the horizon and the maths becomes tractable: buying starts a long way behind, and the interesting number is how many years it takes to catch up. This post is general information, not financial advice.
Why buying starts behind
On the day you buy, you are poorer than the renter standing next to you, and by a lot. Three things create that hole.
The cost of getting in. Depending on where you buy, this can include a transfer tax or stamp duty, legal or conveyancing fees, a lender's arrangement fee, a survey, a valuation, and moving costs. Rates vary enormously between countries and even between regions inside one country, and some places scale the tax steeply with price. The UK sets out its version at GOV.UK's Stamp Duty Land Tax pages; US buyers will find closing costs broken down in the home-buying guides published by the Consumer Financial Protection Bureau. Do not guess this figure. It is the single biggest driver of the break-even year and it is knowable in advance.
The cost of getting out. Estate agent or realtor commission, legal fees, and in some markets a capital gains charge. These are usually a percentage of the sale price, so they grow as the house does. A round trip of roughly 5% to 15% of the price is the usual range once both ends are added, with many markets near 8% to 10% and high-transfer-tax jurisdictions beyond it. This is the cost people forget, because it sits in a future they have not thought about.
Front-loaded interest. In the early years of a repayment mortgage, most of what you pay is interest, not equity. On an illustrative 360,000 loan at 5.5% over 25 years, the payment is about 2,211 a month, and the first twelve months split roughly 19,600 to interest and 6,900 to principal. You build equity, but slowly at first. It is the same mechanism explained from the payment side in our guide to 15 vs 30-year mortgages.
What the calculation actually compares
A calculation that only lines the rent up against the mortgage payment will always flatter buying, because it ignores the money the renter still has. The honest version compares net wealth on both sides at the end of year N.
The buyer's position: what the house is worth, minus what is still owed on the mortgage, minus what it would cost to sell it that year.
The renter's position: the deposit and purchase costs they never spent, invested from day one, plus every month's difference between the owner's outgoings and their rent, also invested.
That second component matters more than people expect. In the illustrative middle case below, the owner's monthly cash cost is about 2,711 (a 2,211 mortgage payment plus 500 of running costs) against rent of 1,600. The renter is roughly 1,111 a month better off and is assumed to invest all of it. Over ten years that is a substantial portfolio, and it is why buying does not win in year one just because the house went up.
Two caveats. First, it assumes the renter actually invests the difference rather than spending it, which many people do not; the forced-saving discipline of a mortgage is a real behavioural argument for buying. Second, investment returns are not guaranteed and past performance does not predict future results — Investor.gov is a reasonable starting point on that. A model assuming a smooth annual return is a simplification, not a forecast. The companion piece is renting throwing money away? works through what the renter is and is not actually losing.
Four illustrative scenarios
The table below runs the same property through four different worlds. Every scenario shares a starting point: a home priced at 400,000 in whatever currency you like, a 10% deposit, a 25-year repayment mortgage, rent starting at 1,600 a month, running costs of 1.5% of the home's value a year, and an assumed 5% a year return on the renter's invested money to keep things simple. Everything scales, so the currency does not change the answer. These figures are illustrative, chosen to show the mechanism, not predictions.
| Scenario | Buying costs | Selling costs | Mortgage rate | House price growth | Rent growth | Break-even |
|---|---|---|---|---|---|---|
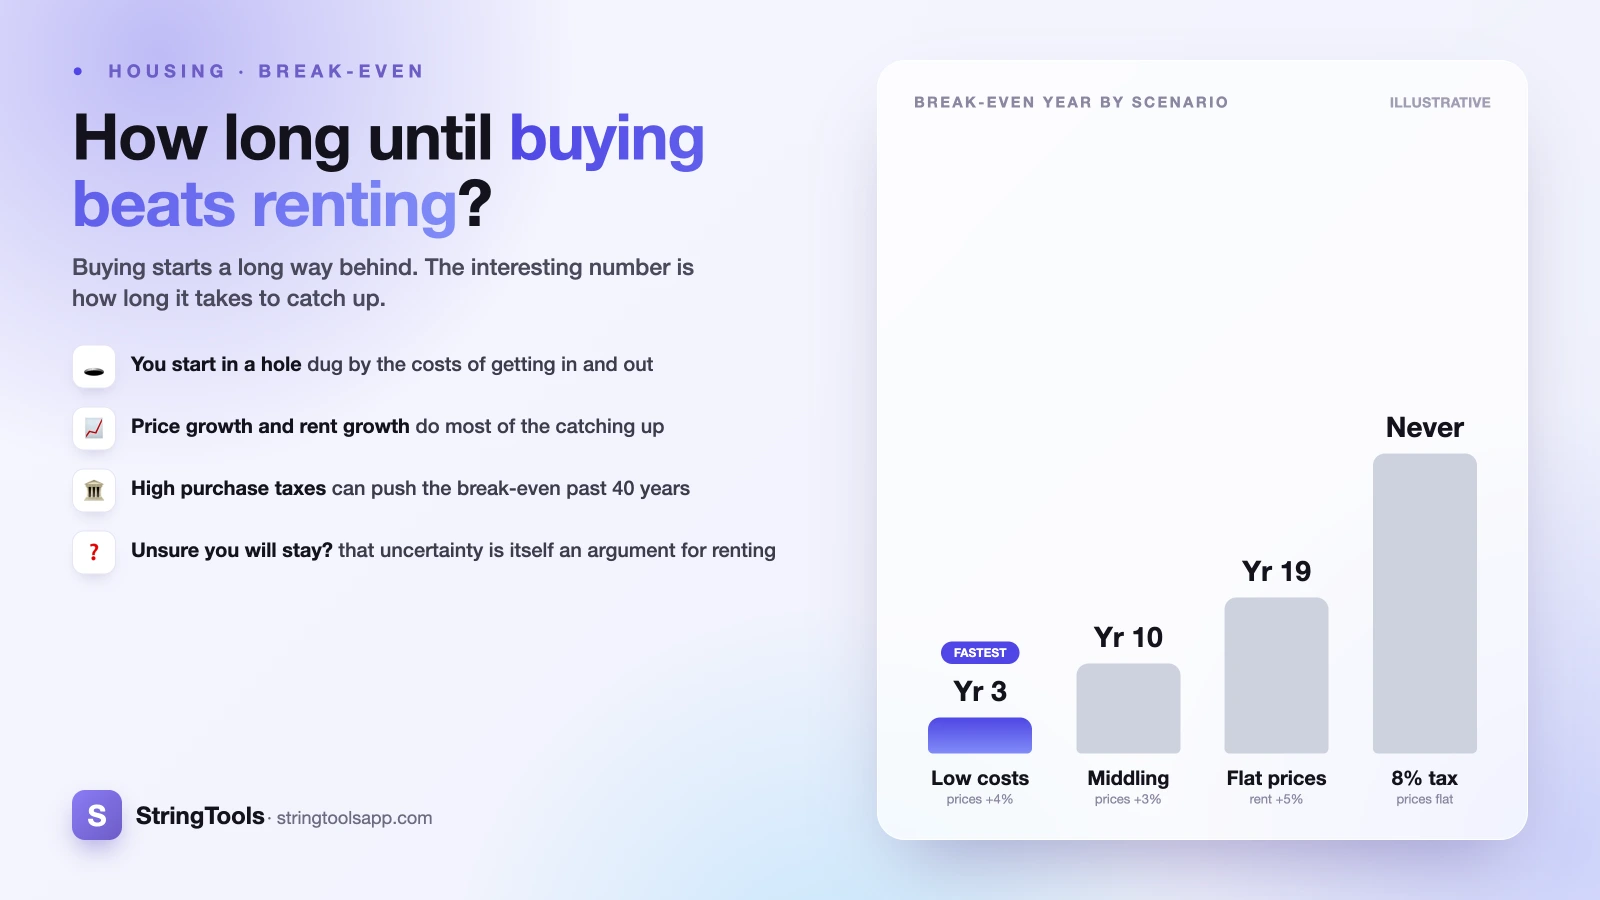
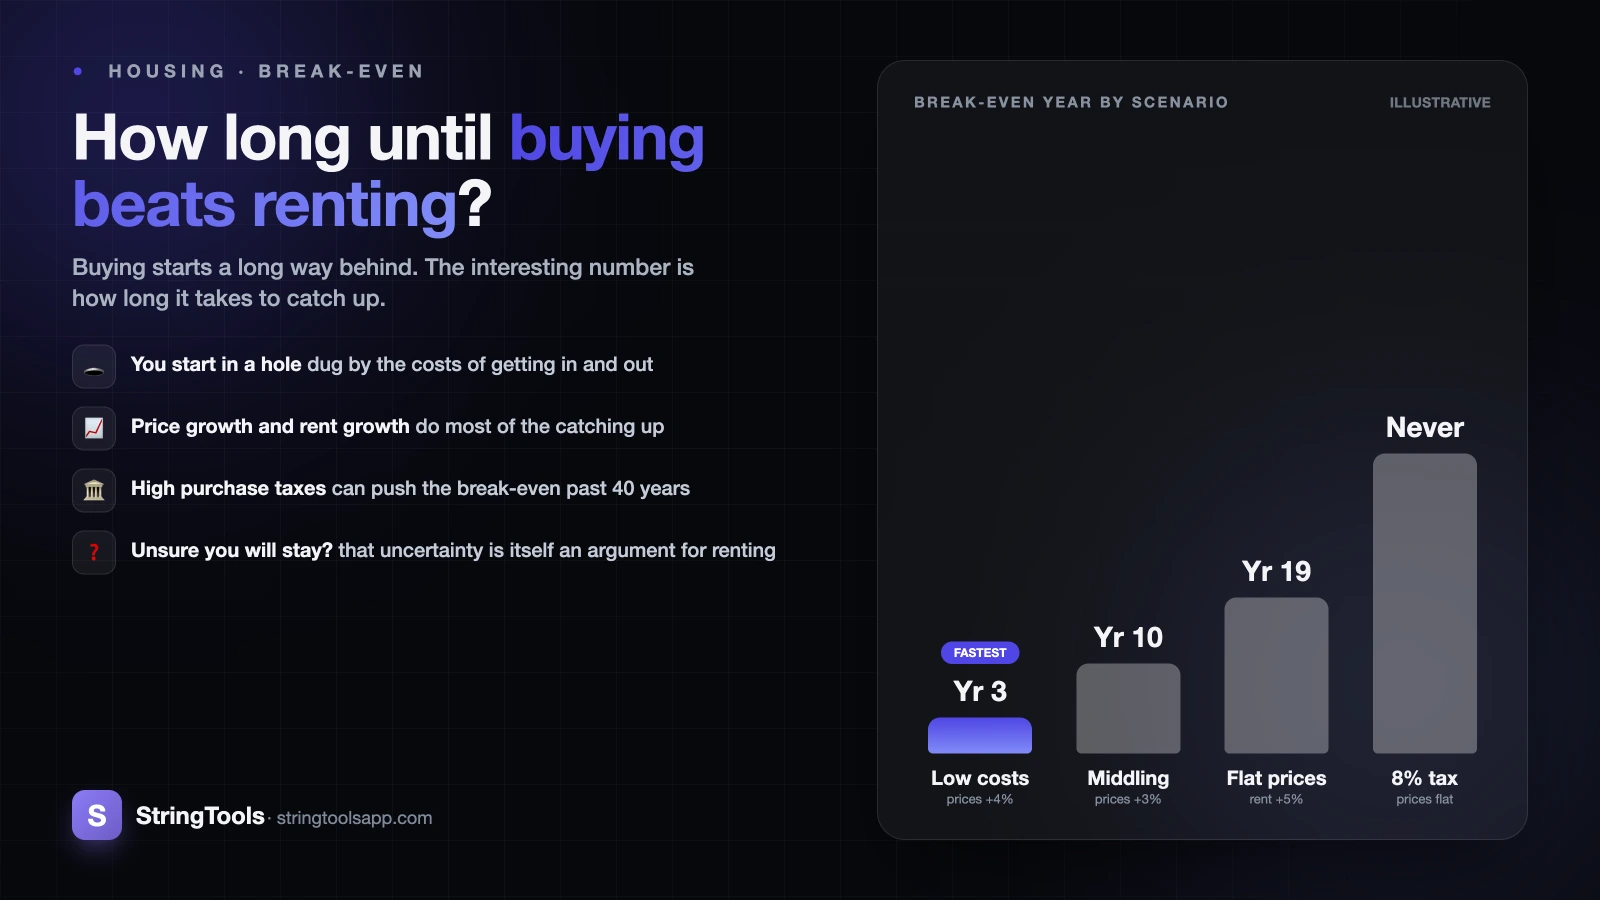
| 1. Low costs, prices rising | 2% | 4% | 5.0% | 4.0% | 3.5% | Year 3 |
| 2. Middle of the road | 3% | 6% | 5.5% | 3.0% | 3.0% | Year 10 |
| 3. Flat prices, rent rising fast | 3% | 6% | 5.5% | 0.0% | 5.0% | Year 19 |
| 4. High purchase tax, flat prices | 8% | 6% | 6.5% | 0.0% | 3.0% | Not within 40 years |
Four points are worth pulling out of that table.
The spread is the finding. Three years to never, from assumption changes that are all individually plausible. Anyone who tells you the answer is five years, or seven, is quoting one row of a table like this one and leaving the rest out.
Scenario 4 is not a trick. An 8% purchase cost is ordinary in several European markets once transfer tax and notary fees are added, and a flat decade for house prices has happened in plenty of places. With a 14% round trip to recover and no price growth to recover it with, the arithmetic never turns.
Scenario 3 gets worse before it gets better. The buyer is furthest behind at around year 9, then the gap closes and crosses at year 19. Rent compounding at 5% while the mortgage payment stays fixed is what does it: eventually the rent overtakes the mortgage, and the renter's monthly surplus becomes a monthly deficit. A fixed mortgage payment is an inflation hedge on the largest bill in most household budgets.
Scenario 1 crosses fast because both ends are cheap. A 6% round trip against 4% annual price growth is recovered in under two years of appreciation.
What moves the break-even, and by how much
The more useful exercise is to take one scenario and change one assumption at a time. The table below starts from scenario 2 above, which breaks even at year 10, and alters a single input.
| Change from the middle case | New break-even |
|---|---|
| Selling costs 6% to 2% | Year 6 |
| Selling costs 6% to 10% | Year 13 |
| Buying costs 3% to 8% | Year 15 |
| House price growth 3% to 5% | Year 4 |
| House price growth 3% to 1% | Year 28 |
| Mortgage rate 5.5% to 4.0% | Year 5 |
| Mortgage rate 5.5% to 7.0% | Year 25 |
| Rent growth 3% to 5% | Year 8 |
| Rent growth 3% to 1% | Not within 40 years |
| Investment return 5% to 2% | Year 6 |
| Investment return 5% to 8% | Not within 40 years |
| Running costs 1.5% to 0.8% of value a year | Year 6 |
| Deposit 10% to 25% | Year 9 |
The pattern is clear enough to state as rules.
Pushing the break-even out: high purchase taxes and fees, high selling commission, flat or falling house prices, a high mortgage rate, high maintenance and property charges, cheap rent locally, and strong returns on the money you did not put into a deposit.
Pulling it in: low transaction costs at both ends, rising house prices, a low mortgage rate, rent rising faster than your ownership costs, and weak investment returns on the alternative.
Notice the two rows that never cross. Both are cases where renting is durably the better financial deal: rent that barely rises, or investment returns that beat property comfortably. Neither is guaranteed to persist, which is the honest limit of the exercise — you are comparing one uncertain future against another. Note too that deposit size barely moves the answer, because a bigger deposit reduces the mortgage and the renter's invested pot by the same amount.
The four assumptions people get wrong
Assuming house price growth from memory. Most people anchor on the last decade in their own city, which is exactly the period least likely to repeat. Run the model at 0% growth as well as your optimistic number. If buying only works at 5% a year, you have not made a housing decision, you have made a leveraged bet on one asset in one postcode.
Forgetting the exit. The break-even is a round trip. A calculation that ignores selling costs will tell you buying wins several years earlier than it does. If you might sell in five years, model the sale in five years.
Treating the mortgage payment as the cost of owning. Maintenance, buildings insurance, and property taxes or service charges run in the region of 1-4% of the property's value a year for most homes, and towards the top of that for older properties or flats carrying a service charge, and they rise with the house rather than staying fixed like the mortgage.
Ignoring what the deposit could have done. A 40,000 deposit plus 12,000 of purchase costs is 52,000 of capital removed from every other use. Whether or not you would actually have invested it, it has an opportunity cost, and a model that leaves it out is not comparing like with like. Our sibling post rent vs buy: which is actually cheaper? works through the full cost stack on both sides.
When the horizon is the wrong question
The break-even year is a number about money, and the decision is not only about money.
You do not know how long you will stay. People plan for ten years and move in four. Redundancy, a relationship, a sick parent, a better job in another city. The model asks you to commit to a horizon, and the honest answer for many people is that they cannot. That uncertainty has a value, and it favours renting, because renting is the option that stays cheap to reverse.
Forced selling breaks the model. The scenarios above assume you choose your exit year. If you have to sell in a soft market, the break-even is not delayed, it is missed. Leverage cuts both ways: with a 10% deposit, a 10% fall in prices wipes out the equity entirely before selling costs.
Some of the value is not financial. Security of tenure, the ability to redecorate, no landlord ending the tenancy. Equally, renting buys mobility and someone else's problem when the boiler fails. Neither side of that ledger belongs in a spreadsheet, but both belong in the decision.
Affordability comes before break-even. A house that breaks even in year six but leaves you unable to save for anything else is not a good outcome. Work out the ceiling first, using something like how much house can I afford?, and only then ask how long the purchase needs to run.
Running it on your own numbers
You need eight inputs, and six of them you can find out rather than guess.
- Purchase price and deposit. Known.
- Total buying costs. Get the actual transfer tax or stamp duty for your price band from your national authority, then add real quotes for legal, survey and lender fees. Do not use a rule of thumb.
- Total selling costs. Ask two local agents what they charge, and add legal fees.
- Mortgage rate and term. From an actual quote, not a headline figure.
- Running costs. Your property tax or service charge, an insurance quote, and a maintenance allowance. 1% to 1.5% of the property's value a year is a reasonable planning floor, and more for an older property or one carrying a service charge.
- Local rent and how fast it has been rising. You know what you pay now; your national statistics agency publishes rent indices for the trend.
- House price growth. The one you cannot know. Run it at 0%, at a modest figure, and at an optimistic one, and see whether your decision changes.
- Investment return on the deposit. Also unknowable. Use a deliberately plain assumption and remember returns are not guaranteed.
Then run the comparison at three, five, ten and fifteen years rather than hunting for a single crossover point. The useful output is not "year 10" but "we are behind until roughly year 8 or 9 in most versions of this, so we should not buy unless we are confident about staying that long." That framing survives being wrong about the inputs, which a single number does not.
You can run the whole comparison, including transaction costs and the invested deposit, in the rent vs buy calculator. Change one assumption at a time and watch the break-even move; that sensitivity is the thing worth understanding, more than any year the model prints. For a decision involving this much money, take your numbers to a regulated adviser or a mortgage broker first.
Frequently Asked Questions
How many years do you have to own a house to break even?
There is no single number, and anyone quoting one is quoting one set of assumptions. In illustrative modelling, a market with low transaction costs and rising prices can break even inside three years, a middling case takes around ten, and a market with high purchase taxes and flat prices may never break even at all. The controllable inputs are your buying and selling costs, your mortgage rate, and your running costs. The uncontrollable ones are house price growth and investment returns.
Does a bigger deposit make you break even sooner?
Barely. It feels like it should, because the mortgage and the interest both shrink, but the same money is removed from the renter's invested pot in the comparison. In the illustrative middle case above, raising the deposit from 10% to 25% moved the break-even from year 10 to year 9. A bigger deposit reduces your monthly payment, your interest bill and your risk of negative equity, all of which are good reasons for one. Accelerating the break-even is not really among them.
Why does buying look better when rents are rising fast?
Because a fixed-rate mortgage payment does not rise and rent does. In the illustrative scenario with flat house prices and rent rising 5% a year, the buyer is furthest behind at around year 9 and then catches up, crossing at year 19, purely because the rent eventually overtakes the ownership costs. From that point the renter's monthly surplus becomes a monthly deficit. This is the strongest financial argument for owning in a market where prices are not moving.
What if house prices fall after I buy?
The break-even is pushed out, and with a small deposit it can be pushed out a long way. With a 10% deposit, a 10% fall in prices removes your equity entirely before you have even paid selling costs, which is negative equity. The model assumes you can choose when to sell; a forced sale in a falling market turns a delayed break-even into a realised loss. This is why the length of time you are confident you can stay matters more than the precise growth rate you assume.
Should I include the money I would have invested instead of a deposit?
Yes, or the comparison is not a comparison. The deposit plus purchase costs is capital that has an alternative use, and leaving it out systematically favours buying. The fair test is your net wealth as an owner against your net wealth as a renter who invested that money. The reasonable objection is behavioural: many people would not actually invest it, and a mortgage forces saving. If that describes you, model a lower investment return to reflect it, but do not set it to zero.
Is it ever worth buying if you might move in two or three years?
Financially it rarely is, because the round trip of buying and selling costs commonly runs to somewhere between 5% and 15% of the price, often near 8% to 10%, and two or three years is not long enough to recover that except in a rapidly rising market you cannot count on. There are non-financial reasons that can outweigh it, such as security of tenure or a lack of decent rental stock where you need to live. But treat a short horizon as an argument against buying that something else has to overcome, not as a neutral starting point.
Sources and references
GOV.UK's Stamp Duty Land Tax pages (gov.uk) · Consumer Financial Protection Bureau (consumerfinance.gov) · Investor.gov (investor.gov). Content was reviewed against these sources as of the last-updated date above; external figures and rules may change after publication.