
Cost per mile is the only figure that compares two cars
Add every ownership cost across the years you keep a car — depreciation, fuel or charging, insurance, servicing and tyres, tax and registration, parking — then divide by the miles you drive. That figure, the cost per mile, is the only number that compares two different cars honestly, because it prices both the car and the use you actually get from it.
Key Takeaways
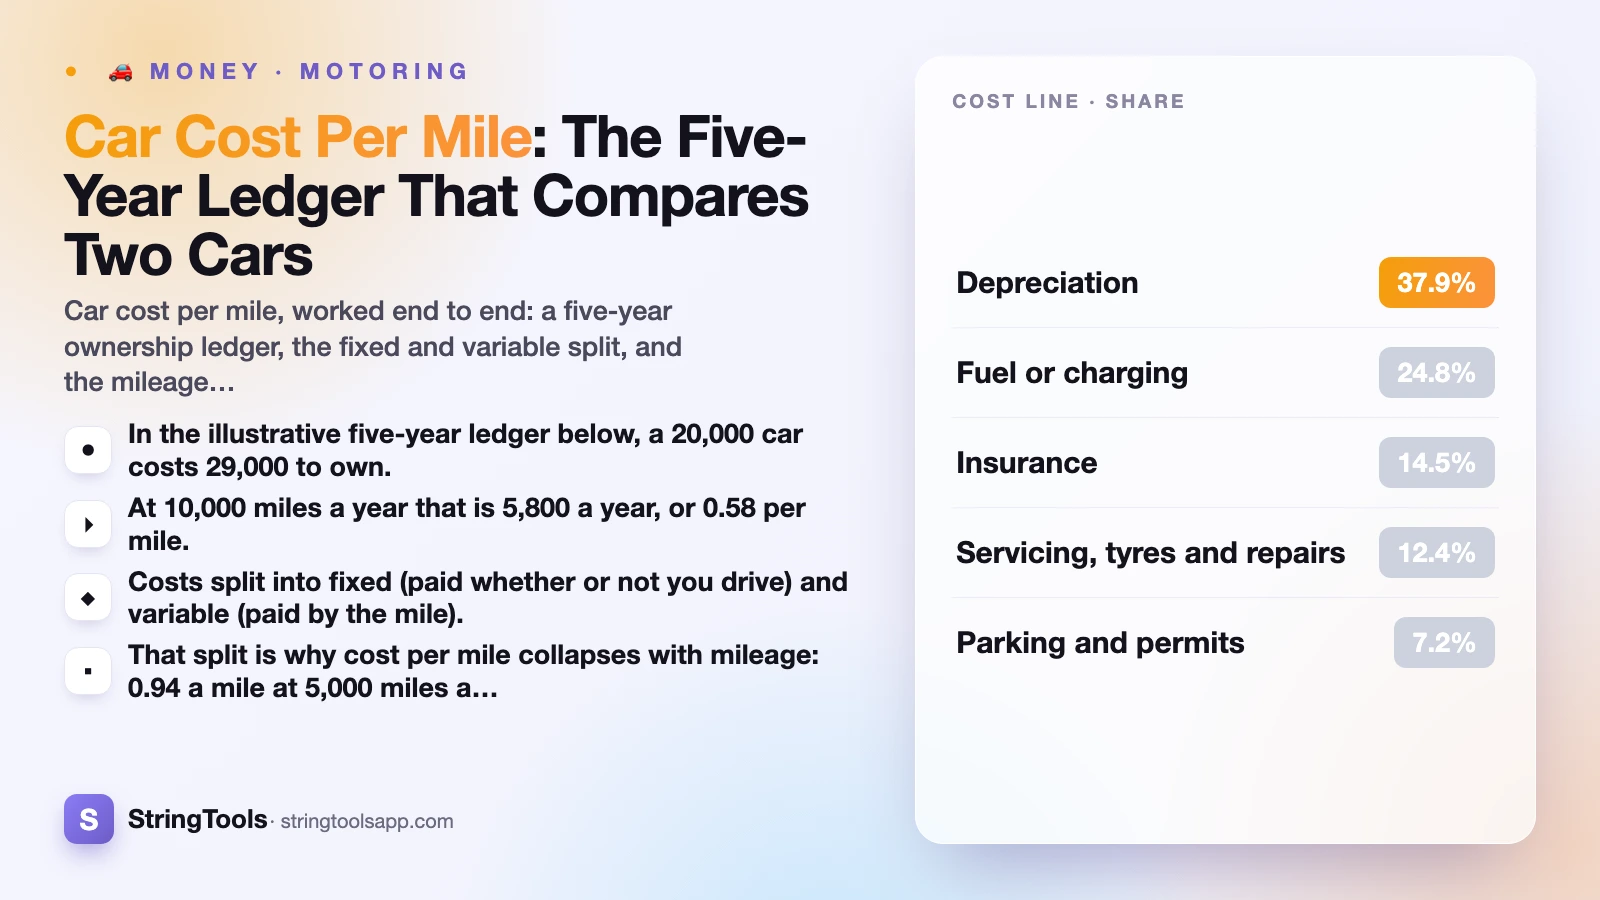
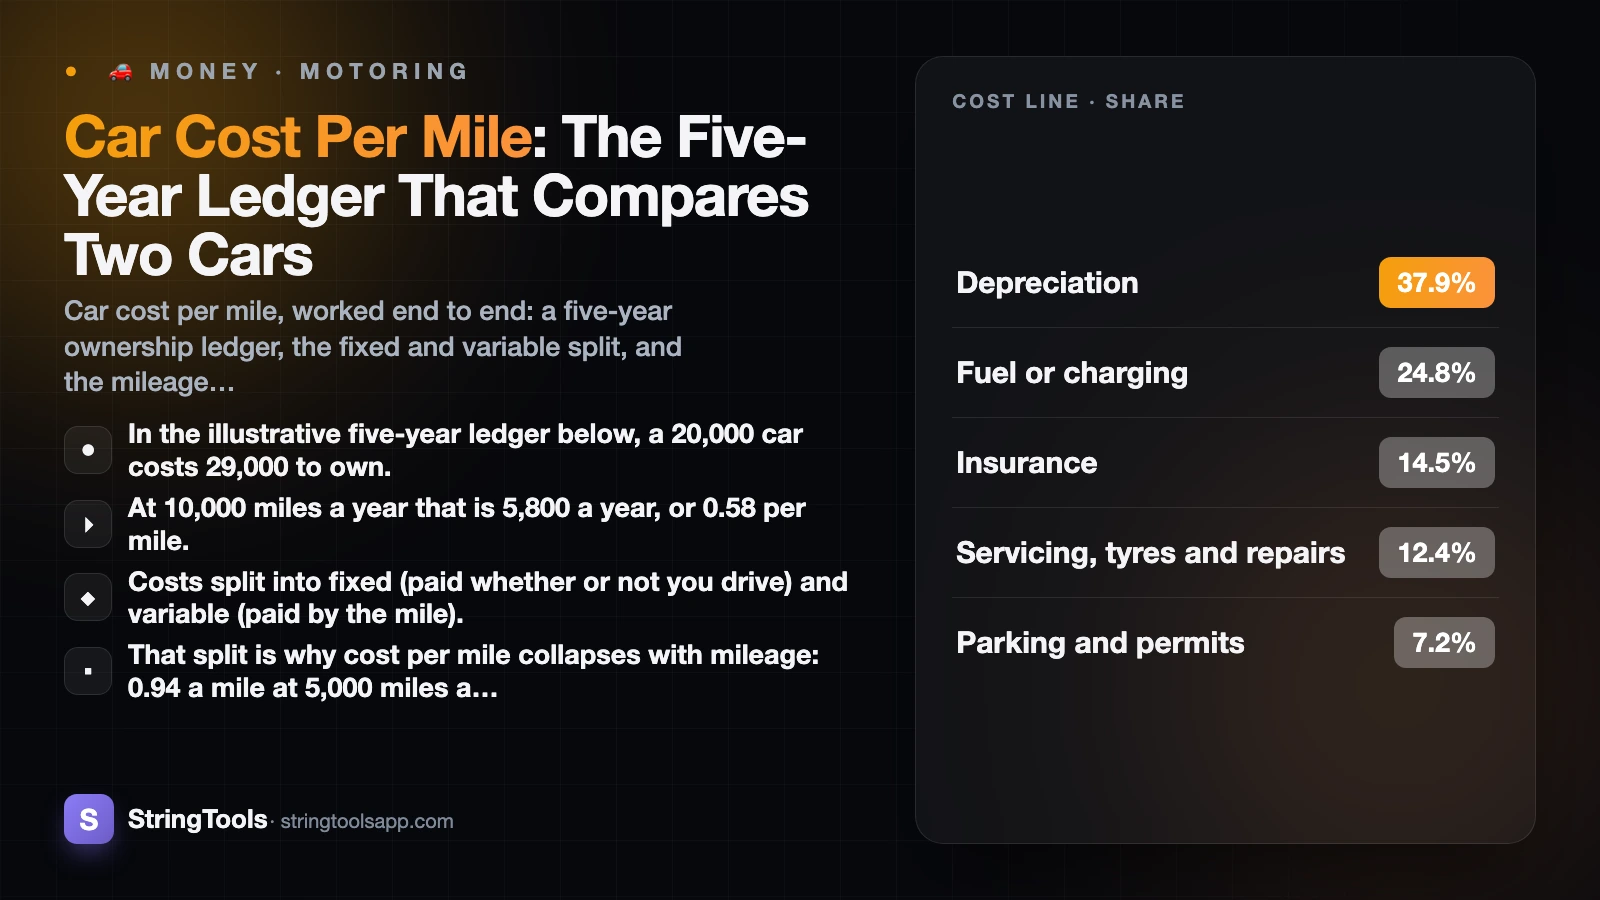
- In the illustrative five-year ledger below, a 20,000 car costs 29,000 to own. Depreciation alone is 11,000 of it, or 37.9%.
- At 10,000 miles a year that is 5,800 a year, or 0.58 per mile.
- Costs split into fixed (paid whether or not you drive) and variable (paid by the mile). Here that is 3,640 a year plus 0.216 a mile.
- That split is why cost per mile collapses with mileage: 0.94 a mile at 5,000 miles a year, 0.40 at 20,000. A car used twice a week is an expensive car per mile, however cheap it is to fuel.
- Because each car is a fixed cost plus a rate, two cars cross at a computable mileage. In the example below, the cheaper car stops being cheaper at exactly 10,000 miles a year.
- The finance payment does not belong in the ledger. It repays the price, and depreciation is the part of the price you never get back, so counting both double-counts most of the car. Count interest instead.
This is the whole-life view, in years and miles. For the same costs arranged as a monthly household budget line, including the finance instalment, what a car really costs per month takes that angle. All figures here are illustrative and chosen to keep the arithmetic clear. This is general information, not financial advice.
Five years, one car, every line in the ledger
Take a car bought for 20,000 and sold five years later for 9,000. Insurance runs 840 a year, servicing and tyres are budgeted at 720, tax and registration at 180, parking and permits at 420, and fuel at 1,440 — the last one being the figure you should replace with your own from the fuel cost calculator rather than trusting anybody's average.
| Cost line | Five-year total | Per year | Share |
|---|---|---|---|
| Depreciation | 11,000 | 2,200 | 37.9% |
| Fuel or charging | 7,200 | 1,440 | 24.8% |
| Insurance | 4,200 | 840 | 14.5% |
| Servicing, tyres and repairs | 3,600 | 720 | 12.4% |
| Parking and permits | 2,100 | 420 | 7.2% |
| Tax and registration | 900 | 180 | 3.1% |
| Total | 29,000 | 5,800 | 100% |
Shares are rounded, so they sum to 99.9 rather than exactly 100.
Two things stand out. The largest line never arrives as a bill, and the line most people shop on — the purchase price — appears only indirectly, as the part of it you do not get back. You did not spend 20,000 on the car. You spent 11,000 on it and lent the other 9,000 to yourself for five years.
Divide the annual total by your annual mileage and you have the figure the rest of this post is built on: 5,800 over 10,000 miles is 0.58 a mile.
Depreciation: the shape matters more than the rate
Depreciation is the difference between what you paid and what you get back, and it is the biggest single cost of owning most cars. Any specific percentage you see quoted deserves suspicion, because the spread between models is enormous: two cars at the same price can return wildly different fractions of it five years later, and the same model can behave differently in different markets and at different mileages.
What is reliable is the shape. The curve is steep at the beginning and flattens later. Most of the value a car will lose in its first decade goes in the early years, which is why the first owner carries the heaviest cost and why the same car looks like much better value once someone else has taken that hit. It is also why a short ownership period is expensive per year and a long one is cheap: keeping a car to ten years spreads a broadly similar loss across twice the time.
Three things move the curve in ways you can act on. Mileage: heavy use pulls resale value down and drags the servicing line up with it. Condition and history: a complete service record is worth real money at sale. And demand for the specific model, trim and fuel type, which you cannot control but can research before you buy rather than after.
The practical consequence is that the depreciation line belongs in your ledger as an estimate you revisit, not a constant. Enter a figure you can defend, see what it does to the total, then try a pessimistic one. If the decision flips between the two, you have found the thing your purchase actually depends on.
Fixed costs, variable costs, and why mileage decides everything
Split the ledger a different way. Some costs arrive whether the car leaves the drive or not: depreciation is largely time-based, and insurance, tax and a parking permit are billed by the year. Others are bought by the mile: fuel, tyres, and a good part of servicing.
In the example, the fixed side is 2,200 of depreciation, 840 of insurance, 180 of tax and 420 of parking — 3,640 a year. The variable side is 1,440 of fuel plus 720 of servicing across 10,000 miles, which is 0.216 a mile. So the annual cost is 3,640 + 0.216 x miles, and the cost per mile is that divided by the miles.
| Miles a year | Fixed costs | Variable costs | Total for the year | Cost per mile |
|---|---|---|---|---|
| 5,000 | 3,640 | 1,080 | 4,720 | 0.94 |
| 10,000 | 3,640 | 2,160 | 5,800 | 0.58 |
| 15,000 | 3,640 | 3,240 | 6,880 | 0.46 |
| 20,000 | 3,640 | 4,320 | 7,960 | 0.40 |
The low-mileage row is the one that surprises people. Drive 5,000 miles a year and each mile costs 0.94, because the same 3,640 of fixed cost is spread across half the distance. A car used twice a week is an expensive car per mile, however cheap it is to fuel.
One honest caveat: the table holds depreciation and servicing constant across the rows, and in reality high mileage accelerates both. The 20,000-mile row is therefore optimistic. Treat the direction as solid and the far column as a best case.
The lines people underestimate
Ledgers go wrong in predictable places, and all of them make the car look cheaper than it is.
- Tyres. A full set is a several-hundred bill that lands every few years, and nobody budgets for it monthly. Larger wheels make it worse.
- The first big repair. Warranties end. A clutch, a turbo or a battery module is the kind of bill that makes a year's ledger look nothing like the last one. A monthly set-aside turns an emergency into a budget line.
- Insurance excess and premium changes. The excess is a real cost you pay only when something goes wrong, and one claim can raise the premium for years afterwards.
- Parking, permits and tolls. Trivial in a village, and one of the largest lines in a city. Check what a residents' permit costs where you would actually keep the car.
- Servicing at a franchised dealer while the car is young, which is often a condition of the warranty and costs more than the independent garage you were imagining.
- The costs of buying and selling — transfer fees, registration, the inspection, the advert. Small individually, but real, and they repeat every time you change car.
None of these is a reason not to own a car. They are a reason for the set-aside line to be larger than your optimism suggests. For the tax and registration line, check the actual figure for the specific vehicle: the UK publishes vehicle tax rates by emissions and list price, and the US Department of Energy's fuel economy database will give you a defensible efficiency figure for the fuel line.
Where two cars cross, and why the answer is a mileage
Once both cars are expressed as a fixed annual cost plus a rate per mile, comparing them stops being an argument and becomes a line crossing. This is the payoff for building the ledger: the answer to "which car is cheaper" is not a car, it is a mileage.
Take the car above — 3,640 fixed, 0.216 a mile — against a cheaper alternative that costs less to buy and insure but is thirstier and costlier to service: 2,800 fixed and 0.30 a mile.
| Miles a year | Car A: 3,640 + 0.216/mile | Car B: 2,800 + 0.30/mile | Cheaper |
|---|---|---|---|
| 5,000 | 4,720 | 4,300 | Car B |
| 10,000 | 5,800 | 5,800 | Identical |
| 15,000 | 6,880 | 7,300 | Car A |
| 20,000 | 7,960 | 8,800 | Car A |
They cross at exactly 10,000 miles a year, because the 840 difference in fixed cost divided by the 0.084 difference per mile is 10,000. Below that, the cheaper car wins. Above it, the efficient one does, and the gap widens with every mile.
This is why "which fuel is cheapest" has no general answer, only a personal one that depends on your annual mileage and driving pattern. Petrol, diesel, CNG and EV running costs compared works through where each one lands, and the crossing point is the reason the honest answer is always "it depends how far you drive".
Build your own ledger in twenty minutes
Start with the two figures that carry the ledger. Write down the price you would pay and a defensible estimate of what the car would fetch after the years you intend to keep it. The difference, divided by those years, is your depreciation line, and it will probably be the largest number on the page.
Then get real quotes rather than averages. Two insurance quotes on the exact model with your details. One fuel cost run at your actual weekly mileage. The tax figure for that specific vehicle. The parking cost where you live. A servicing set-aside based on what the car's scheduled service actually costs, plus something for tyres.
Add them, divide by twelve for a monthly figure and by your annual mileage for the cost per mile. Then do the same for the other car on your shortlist, including one that is several years older, since the depreciation line is where new versus used is decided.
If you would rather not keep a spreadsheet, the car affordability calculator carries all six running-cost lines and depreciation alongside the finance payment, and shows the cash cost and the true cost separately so the two are not confused. Everything stays in your browser on that device.
What to do with the cost per mile once you have it
The first use is comparison. A cost-per-mile figure lets you compare a cheap car you will run into the ground against an expensive one that holds its value, which no other single number does.
The second is budgeting. Ownership costs are lumpy, and the ledger converts them into a set-aside you can plan. Of the 5,800 a year, roughly 3,600 is cash you actually pay out — fuel, insurance, servicing, tax, parking — and that is what should be leaving your account into a separate pot, so the tyres and the service come out of the pot rather than out of a credit card. The remaining 2,200 is depreciation, which you settle in one go on the day you sell.
The third use is the uncomfortable one. Put the total next to what the car is for. A vehicle that costs 0.94 a mile because it sits outside six days a week is doing a job that occasional hire or a car club might do for less, and the ledger is the only way to see that clearly. Equally, a car that costs 0.40 a mile and protects the income of a household with no alternative transport is cheap at the price, whatever the monthly figure looks like.
The point of the ledger is not to talk you out of a car. It is to make sure that when you pick one, you are comparing the whole cost of each option rather than the one number the seller chose to show you.
Frequently Asked Questions
What does it cost to own a car for five years?
On the illustrative ledger here, a 20,000 car kept five years and sold for 9,000 costs 29,000 in total across depreciation, fuel, insurance, servicing and tyres, tax and registration, and parking. That is 5,800 a year, or 0.58 a mile at 10,000 miles a year. Depreciation alone is 11,000 of it, 37.9% of the whole, and it never arrives as a bill.
How do I calculate the cost per mile of my car?
Add every ownership cost for a year, including depreciation, then divide by the miles you drive in that year. In the example the annual total is 5,800 at 10,000 miles a year, which is 0.58 a mile. Because much of the cost is fixed, the same car costs 0.94 a mile at 5,000 miles and 0.40 at 20,000.
Should the loan payment go in the cost-per-mile figure?
Not alongside depreciation, or you will count most of the car twice. The payment repays the purchase price, and depreciation is the part of that price you never get back. The cleanest ledger counts depreciation plus the loan interest, and treats the capital portion of the payment as repaying money you already committed.
Why does a car cost more per mile if I barely drive it?
Because depreciation, insurance, tax and parking are billed by the year rather than by the mile. In the example those fixed costs are 3,640 a year. Spread over 5,000 miles that is 0.73 a mile before you buy any fuel; spread over 20,000 miles it is 0.18. Low mileage does not reduce them, it just divides them by a smaller number.
Which line of the ledger is the biggest?
For most cars in their early years, depreciation, though it depends heavily on the model and how long you keep it. It is the largest line in the example above at 11,000 of the 29,000, or 37.9%. Keeping a car longer reduces it per year, because the steepest part of the curve is spread across more years of use, which also pulls the cost per mile down.
How much should I set aside each month for car repairs?
Enough that a single bill does not become debt. A practical approach is to budget the car's scheduled service cost plus a share of a tyre set, then add a margin for the unscheduled repair, and move that amount into a separate account monthly. Older cars and cars out of warranty need a larger set-aside than a new one.
Sources and references
vehicle tax rates (gov.uk) · fuel economy database (fueleconomy.gov). Content was reviewed against these sources as of the last-updated date above; external figures and rules may change after publication.