
The question is not which is better, it is how long you have
Saving and investing are not competing strategies; they suit different deadlines. Cash keeps its value and is there on the day, but grows slowly. Investments can grow faster over long periods, and can also be worth less than you paid when you need them. The deciding question is whether your goal can wait for a recovery.
Key Takeaways
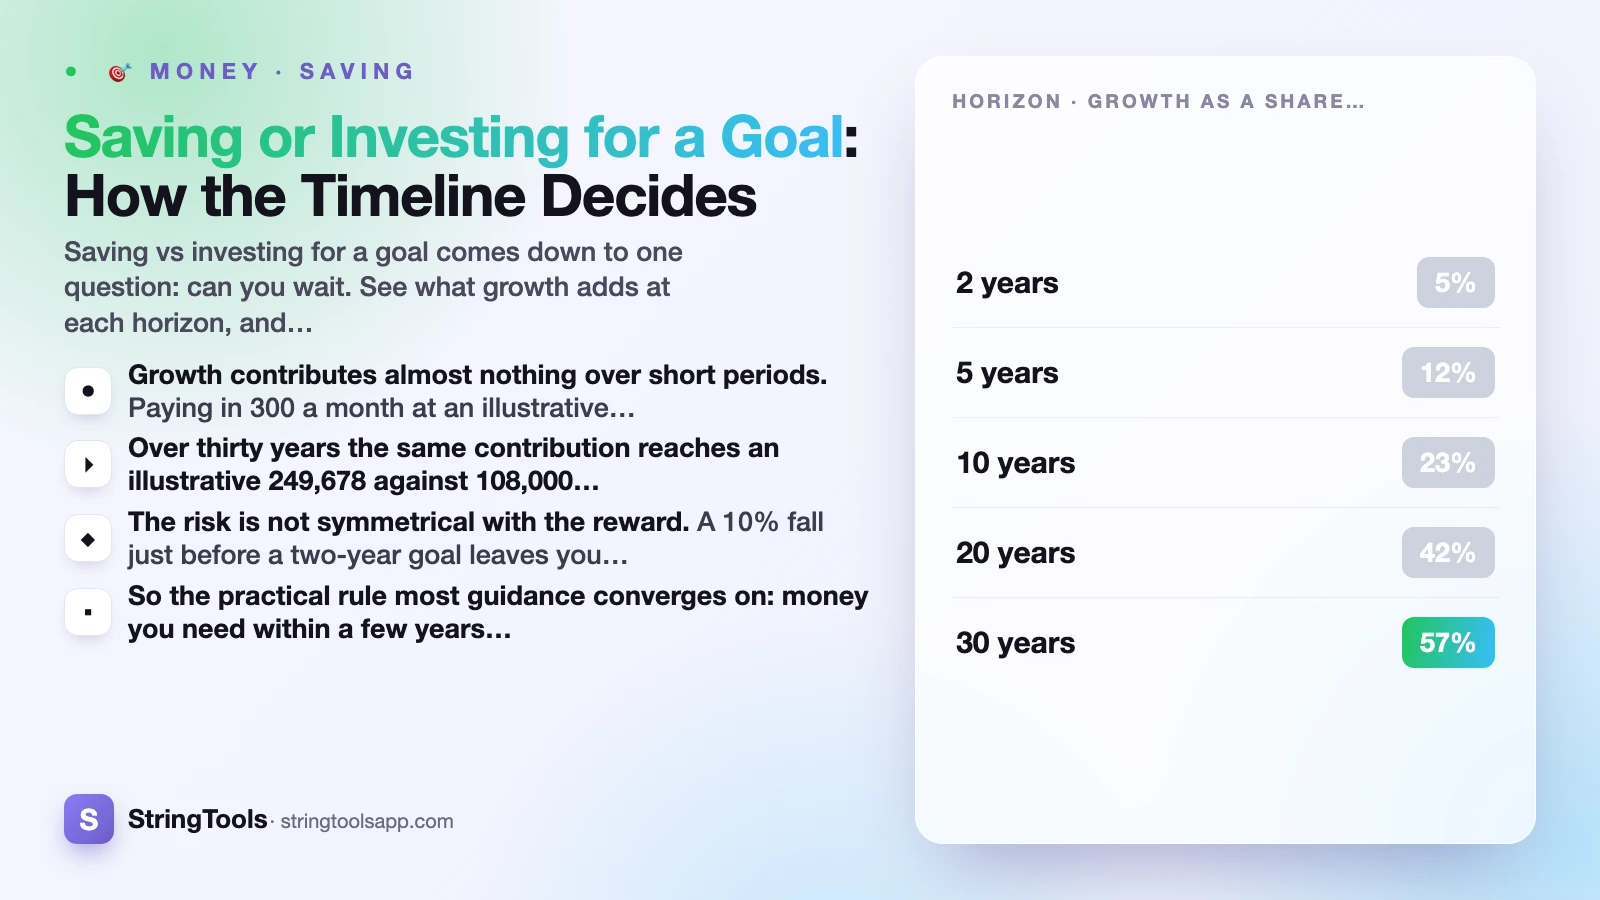
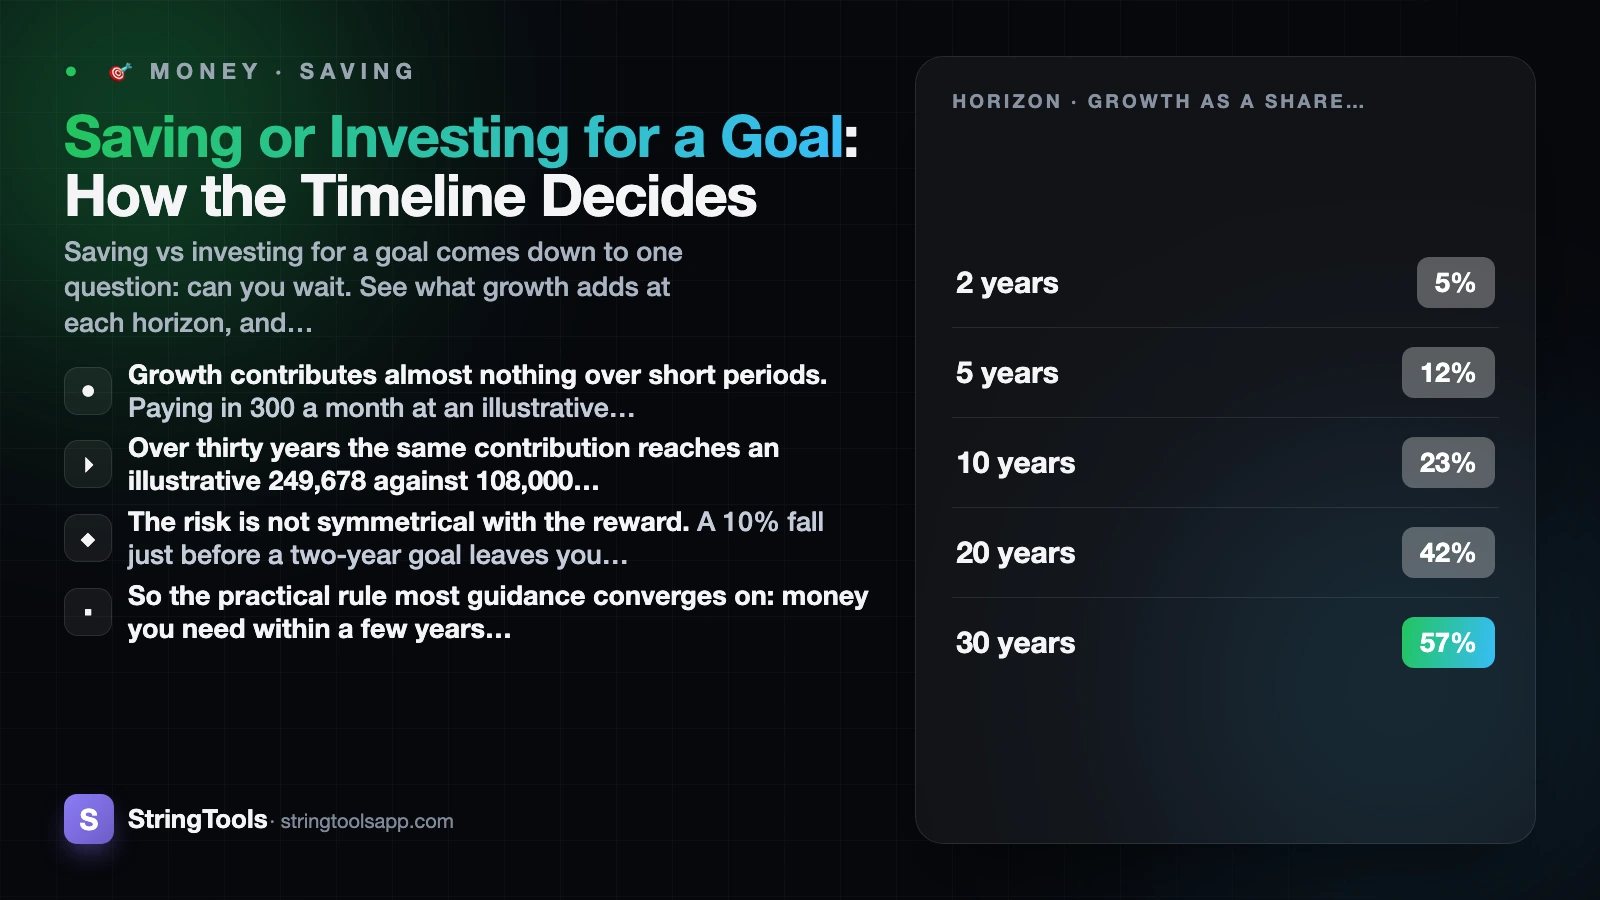
- Growth contributes almost nothing over short periods. Paying in 300 a month at an illustrative 5% a year leaves you with 7,556 after two years against 7,200 paid in: growth is 5% of the balance.
- Over thirty years the same contribution reaches an illustrative 249,678 against 108,000 paid in, and growth is 57% of the balance. The mechanism did not change, only the time it had to work.
- The risk is not symmetrical with the reward. A 10% fall just before a two-year goal leaves you 400 below what you paid in. The same fall before a twenty-year goal leaves you 38,979 above it.
- So the practical rule most guidance converges on: money you need within a few years generally belongs in cash, and money you will not touch for a decade or more is where investment risk has time to be worth taking.
- Every figure here is illustrative arithmetic, not a forecast. Real returns are not a steady percentage, past performance does not predict future results, and no return is guaranteed.
- This post does not recommend any product, fund, account or provider, and it is general information rather than personal financial advice. A regulated financial adviser is the right person for a decision about your own money.
What the two words actually mean
Saving means putting money somewhere its nominal value cannot fall: a bank or credit union account, typically covered by a national deposit protection scheme up to a limit. You know what the balance will be. What you are exposed to is inflation quietly reducing what that balance buys, which is a real cost but a slow and visible one. That erosion is covered in what inflation does to your savings.
Investing means buying assets whose price is set by a market. The value moves in both directions, sometimes sharply, and there is no protection scheme that makes up a fall in value. In exchange, over long periods, investors have historically been compensated for accepting that variability, though nothing obliges that to continue and there are periods where it has not.
The important asymmetry is not about which produces more. It is that saving has a predictable downside you can plan around and investing has an unpredictable one you cannot. A plan with a fixed date has to survive the bad version, not just the average version.
The US Securities and Exchange Commission's investor education service sets out the basics of both, along with the questions to ask before putting money into anything, at Investor.gov.
What growth adds, horizon by horizon
Take the same plan at every length: 300 a month, nothing to start with, and an illustrative 5% a year compounded monthly. The 5% is chosen only to make the arithmetic readable. It is not a prediction, not a rate anyone is offering, and no return is guaranteed.
| Horizon | Total paid in | Balance at 0% | Balance at an illustrative 5% | Growth | Growth as a share of the balance |
|---|---|---|---|---|---|
| 2 years | 7,200 | 7,200 | 7,556 | 356 | 5% |
| 5 years | 18,000 | 18,000 | 20,402 | 2,402 | 12% |
| 10 years | 36,000 | 36,000 | 46,585 | 10,585 | 23% |
| 20 years | 72,000 | 72,000 | 123,310 | 51,310 | 42% |
| 30 years | 108,000 | 108,000 | 249,678 | 141,678 | 57% |
The last column is the argument. At two years, growth is a rounding error on your own deposits, and you have taken on the possibility of a fall in return for 356. At thirty years, more of the balance came from growth than from you.
That is not because long-term returns are better. It is because each deposit earns on the earnings of every deposit before it, and that only becomes visible once there are many years of them stacked up. The mechanism is set out in compound interest explained. The relevant point here is simply that the effect is almost absent early and dominant late, which is why the same decision has different answers at different horizons.
The test that actually decides it: what a bad year costs you
The table above shows the upside. Run the same plan through a fall, and the picture changes shape entirely. Here is that balance with a 10% and a 20% fall applied right at the point you need the money.
| Horizon | Paid in | Balance at 5% | After a 10% fall | Against paid in | After a 20% fall | Against paid in |
|---|---|---|---|---|---|---|
| 2 years | 7,200 | 7,556 | 6,800 | -400 | 6,045 | -1,155 |
| 5 years | 18,000 | 20,402 | 18,362 | +362 | 16,321 | -1,679 |
| 10 years | 36,000 | 46,585 | 41,926 | +5,926 | 37,268 | +1,268 |
| 20 years | 72,000 | 123,310 | 110,979 | +38,979 | 98,648 | +26,648 |
| 30 years | 108,000 | 249,678 | 224,710 | +116,710 | 199,742 | +91,742 |
At two years, a 10% fall wipes out every unit of growth and leaves you 400 short of your own deposits. At five years, a 10% fall still leaves you slightly ahead at 362, but a 20% fall puts you 1,679 behind. By ten years, even a 20% fall leaves the plan ahead of what you paid in.
That crossover is the whole decision, and it is why a rule of thumb about years exists at all. Long horizons have accumulated enough growth that an ordinary fall does not take you below your contributions. Short horizons have not.
One more thing the table cannot show: a fall is only a loss if you have to sell. The twenty-year saver can leave the money alone and let the plan continue. The two-year saver with a completion date, a wedding or a deadline cannot. The constraint is the date, not the market.
A framework you can apply in five minutes
For each goal, write the date and then ask one question: if the money were worth 20% less on that date, what would actually happen.
If the answer is that the goal fails, a purchase collapses, or you would have to borrow, the goal needs certainty rather than growth.
If the answer is that you would wait a year or two and carry on, the goal can tolerate variability.
| Time until you need it | What the money is mainly exposed to | Usual approach |
|---|---|---|
| Under 2 years | Nothing, if held in cash | Cash. Growth cannot arrive in time to matter |
| 2 to 5 years | A fall you have little time to recover from | Cash for anything with a fixed date; a fall at the wrong moment is not recoverable |
| 5 to 10 years | Market variability, with some room to wait | The grey zone. Depends on how movable the date is |
| Over 10 years | Inflation, if held entirely in cash | Long enough that investment risk has historically been compensated, though never guaranteed |
Two boundary cases are worth naming. An emergency fund is always cash regardless of how long you have held it, because its whole purpose is to be available at a moment you cannot predict. And a house deposit is a short-horizon goal even when you plan to buy in five years, because the completion date is partly outside your control and a shortfall can collapse a chain. That is why how to save for a house deposit treats it as a cash goal throughout.
Where the framework breaks
Rules about horizons are useful and incomplete. Four situations bend them.
A goal with no fixed date is not really a short-horizon goal even if you would like the money soon. A kitchen renovation that can happen next year or the year after has flexibility that a wedding does not, and flexibility is the thing that makes variability tolerable.
A long horizon held entirely in cash has its own problem: inflation compounds against you over exactly the periods where growth would have compounded for you. Choosing cash for thirty years is a decision with a cost, not a neutral default. The options and their trade-offs are in how to protect your savings from inflation.
A horizon is not a single date when the money is spent gradually. Money drawn down over twenty years of retirement is not all short-horizon money on day one, which is why that question is usually handled separately from a single-goal plan.
And your own tolerance matters, because the best plan on paper is worthless if you abandon it at the worst moment. Someone who would sell after a fall has, in practice, a shorter horizon than their calendar suggests. The SEC has a short guide to thinking that through at Investor.gov.
Where this reasoning stops working
List your goals with a target and a date each. Sort them by date. Draw a line at a few years out and treat everything above the line as cash, without further debate, because the arithmetic above says growth cannot arrive in time to compensate you for the risk.
For everything below the line, the decision is genuinely personal and it depends on tax rules, your other commitments, what you already hold, and how you would behave in a bad year. That is the point at which a regulated financial adviser earns their fee, and this post deliberately stops short of it. Nothing here recommends a product, a fund, an account type or a provider, and it should not be read as a suggestion that any particular option suits you.
What you can do yourself, on both sides of the line, is work out the contribution the goal requires. The savings goal calculator solves for the monthly amount, the timeline or the final balance, with an optional rate you enter yourself, so you can run a goal at zero and again at a rate you have chosen and see how much of the plan is depending on growth rather than on you. If the plan only works at the higher rate, that is not a plan; it is a hope with a spreadsheet attached.
The method for turning several goals into one set of standing orders is in how much should I save each month.
Frequently Asked Questions
Should I save or invest for a goal?
It depends on when you need the money and whether the date can move. Growth adds very little over short periods: 300 a month at an illustrative 5% is worth 7,556 after two years against 7,200 paid in. Over thirty years the same plan reaches 249,678 against 108,000 paid in. Short goals generally belong in cash; long ones are where investment risk has time to be compensated, though never guaranteed.
How many years do I need before investing makes sense for a goal?
Most guidance draws the line somewhere between three and five years, and the arithmetic explains why. A 10% fall just before a two-year goal leaves you 400 below what you paid in, while at ten years even a 20% fall leaves you 1,268 ahead. The crossover is where accumulated growth covers an ordinary fall. Where you personally draw the line should account for how movable your date is.
Can I invest my house deposit?
A deposit behaves like a short-horizon goal even when the purchase is years away, because completion dates move and a shortfall on the day can collapse a purchase rather than merely delay it. A goal that cannot wait for a recovery has no room for a fall in value. This is general information, not advice on your situation.
Is cash safe if I keep it for a long time?
Its nominal value is protected, within your country's deposit protection limits, but its purchasing power is not. Over long periods inflation compounds against a cash balance in the same way growth would have compounded for an invested one. Holding a thirty-year goal entirely in cash is a decision with a cost, not a neutral default.
What return should I assume when planning?
For a short goal, assume nothing, and treat whatever the account pays as a margin of safety. For a long one, run the plan at more than one figure rather than picking a single number, because the result changes a great deal with the assumption. Real returns arrive unevenly rather than as a steady percentage, and past performance does not predict future results.
Where does an emergency fund fit in this?
Outside the framework entirely. An emergency fund is cash regardless of how long you have held it, because its purpose is to be intact and reachable at a moment you cannot predict. It is the one pot where the date is unknown, which removes any possibility of waiting out a fall.
Sources and references
Investor.gov (investor.gov) · Investor.gov (investor.gov). Content was reviewed against these sources as of the last-updated date above; external figures and rules may change after publication.